Red labradorite (plagioclase) - 1.75 ct - Ethiopia
- Details
- Created: Monday, 30 December 2024 10:58
The red plagioclases (feldspar) are rather rare, vivid red even more. They originate from few locations, Oregon in USA, Democratic Republic of Congo, Tibet / China and more recently (2020) from Ethiopia. The 1.75 ct vivid red labradorite represented in Figure 1 is believed to come from Ethiopia since its classical gemological tests and trace elements chemistry are consistent with Ethiopian red labradorites as reported by Z. Sun et al., 2020[1].
The stone is of a uniformly vivid red and almost clean to the naked-eye and 10x lens. It shows few copper platelets concentrated in a cloud (Figure 2) and some veils visible in the thiner parts of the stone near the girdle (Figure 3). If the stone was viewed upside down in transmitted light, the girdle rim looked yellowish brown, hopefully this is not visible from the table side.
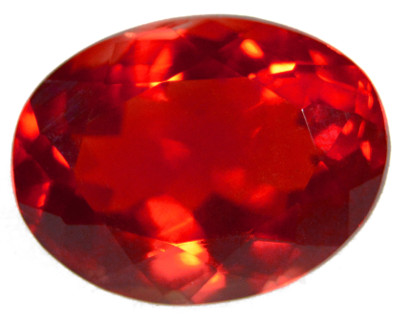 Figure 1. The homogeneous vivid red color of this labradorite is
amazing. It is not too dark and the stone is full of live while tilting it.
With its 1.75 ct, it just measures a small 9x7 mm and is almost free
of inclusion to the naked eye and 10x lens.
| Shape | oval |
| Size | 8.8 x 6.8 x 4.8 mm |
| Color | red |
| Diaphaneity | transparent |
| Lustre | vitreous |
| Weight | 1.75 ct |
| SG | 2.73 [2.70–2.72[1]] |
| RI | 1.561–1.570 [1.562–1.571[1]] |
| DR | 0.009 [0.009[1]], optical character and sign could not be determined, nγ=1.570 was constant |
| Pleochroism | none, at least non-observable with polarizing filters and calcite dichroscopes |
| Polariscope / Conoscope | anisotropic, light and dark 4 times per 360° rotation with biaxial interference figures observed using the conoscope |
| SWUV | inert |
| LWUV | inert |
| Magnetic susceptibility N52 | inert |
| Chelsea filter | red |
Table 1. Observational and measured properties
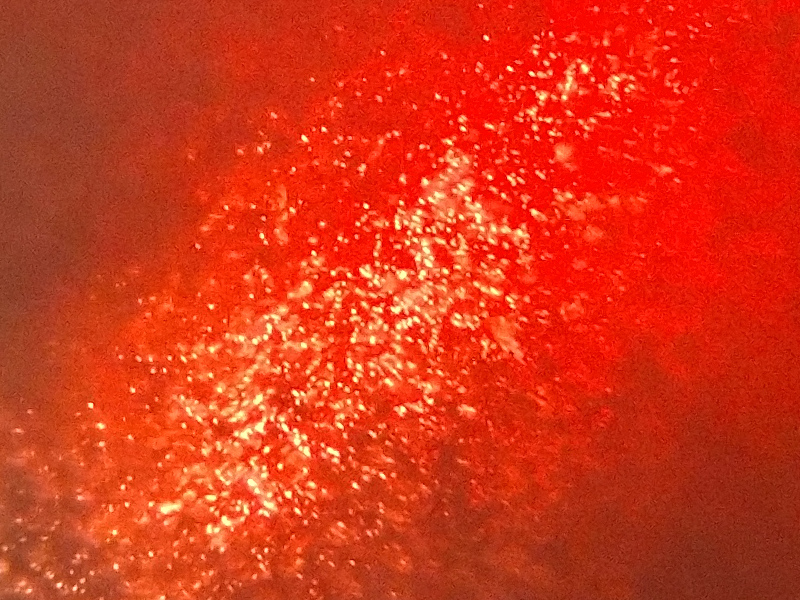
Figure 2. A cloud of tiny copper platelets that strongly reflect light, often described as the schiller effect. The stone of this study contains
very few platelets execpt these in this cloud that is difficult to see with the usual 10x lens, it requires a strong lighting from above. Smartphone
photography through the occular of the binoccular at 20x.
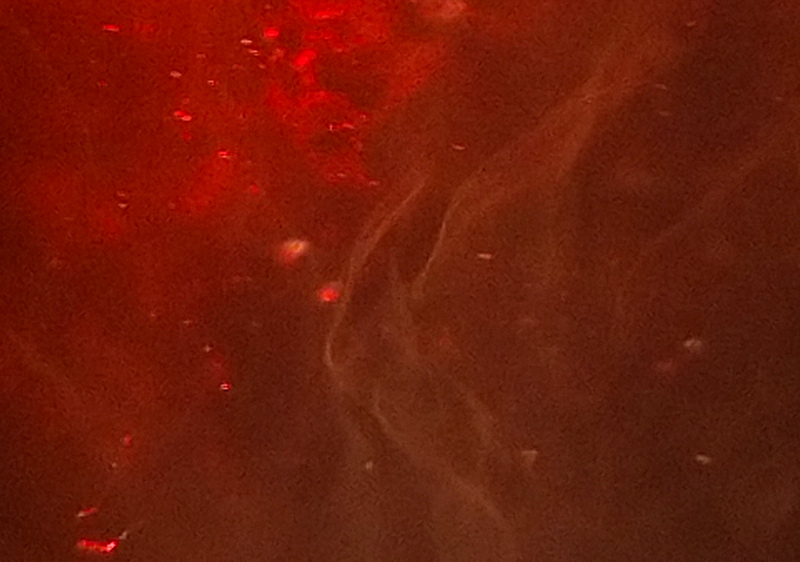
Figure 3. Close to the girdle where the stone is the thinest, some veils can be observed in the lesser red, slightly brownish areas.
Smartphone photography through the occular of the binoccular at 20x.
Infrared reflectance spectroscopy:
The Infrared reflectance spectra were recorded in different orientations, the material being anisotropic, the spectra are also subject to the crystal (stone) orientation. Two spectra were collected from the table, a first one from a random orientation and the last one from the same area of the table but rotated by 90°. A third spectrum was collected from a random facet from the stone's pavillion. All three spectra are shown in Figure 4, the orientation has indeed a significant influence. They are consistent with plagioclase spectra and more precisely with those of labradorite.
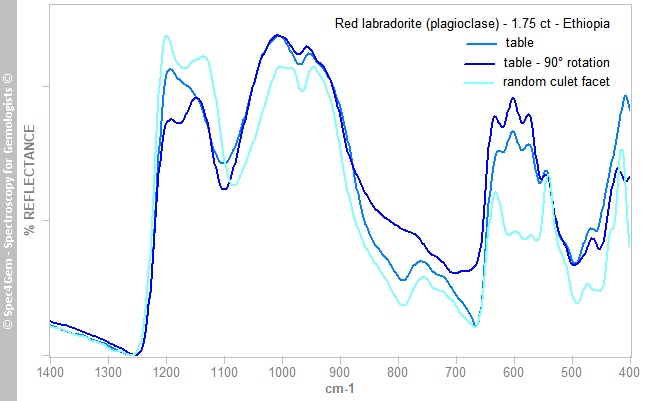 Figure 4. The IR reflectance spectra of the 1.75 ct red labradorite are consistent with labradorite.
Raman spectroscopy:
Several Raman spectra were collected from different spots of the stone with a 636 nm laser, all yielded relatively weak spectra with the prominent peaks only. The spectrum shown in Figure 5 matches the labradorite ones in the 2009 RRUFF database, and anorthite in the 2020 RRUFF database (all plagioclases with an anorthite content higher than 50% are classified as anorthite).
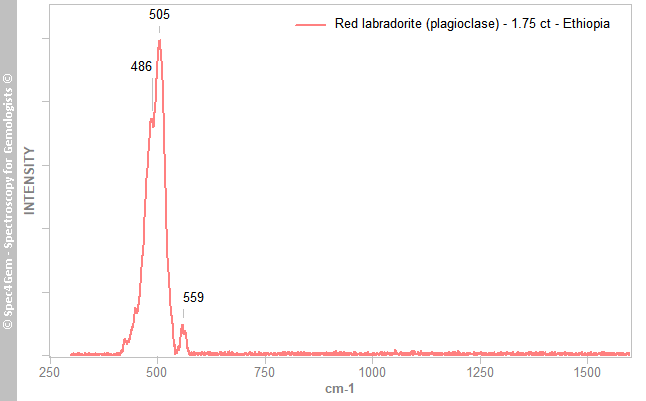 Figure 5. The Raman spectrum of the 1.75 ct red labradorite is consistent with labradorite (50% - 70% anorthite plagioclase).
UV-VIS-NIR spectroscopy:
An unpolarized UV-Vis-NIR spectrum was first collected with a light path set to an angle of about 45° from the table, the light enters the stone by the pavillion side and exits from the table. By experience, the green and red plagioclases have a relatively high absorption above 500 nm that requires a spectrophotometer capable of measuring absorbance as high as 4 or more. The unpolarized / unoriented spectrum is shown in Figure 6, it displays a strong increasing absorption continuum extending towards UV, a medium band at 381 nm, a weak band at 420 nm and the most typical band at 563 nm with a sharp edge dropping to the 600 nm (the band is in really centered at 563 nm even if visually and the 1st derivative is at 558 nm). The overall spectrum has the characteristic pattern observed in the red plagioclases such as in the red oregon sunstone.
According to Hofmeister and Rossman, 1985[2] and Krzemnicki, 2004[3], red labradorite, the band at 560 to 580 nm combined with a general increase of absorption towards ultraviolet is attributed to intrinsic absorption by tiny Cu0 particles which are too small to scatter light (<22 nm), and produces a red color.
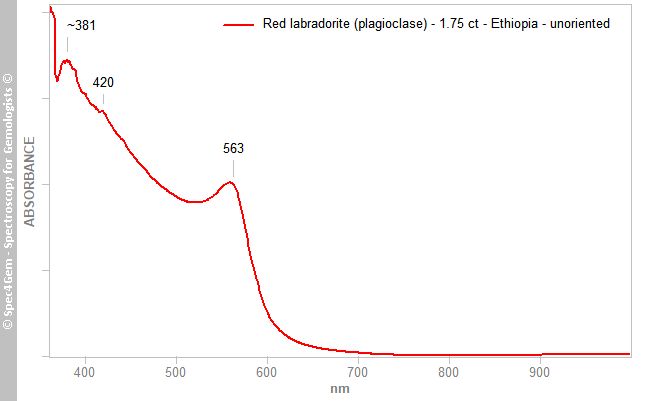 Figure 6. The unoriented Vis spectrum of the 1.75 ct red labradorite shows common absorption bands in plagioclase feldspars at 381 and 420 nm and the characteristic copper-bearing plagiocalses' absorption at 560 nm (usually between 555 and 580 nm).
Using a polarizing filter to separate rays did not give significant result of pleochroism but trying a lot of orientations in the stone was much better. The Figure 7 shows two spectra collected with light paths oriented as the length and the width of the stone, difficult to do better on a facetted gemstone. The two spectra are similar except there is a small shift between them, one has its main band at 559 nm although the other has it at 573 nm. This shift should result in a very weak pleochroism from a orangish red to red. Anyhow, it was observed with the dichroscopes. By experience, and also as reported by other gemologists (Susawee and Sutthirat, 2014[4]), treated pale plagioclases by copper diffusion do not show any pleochroism in their spectra.
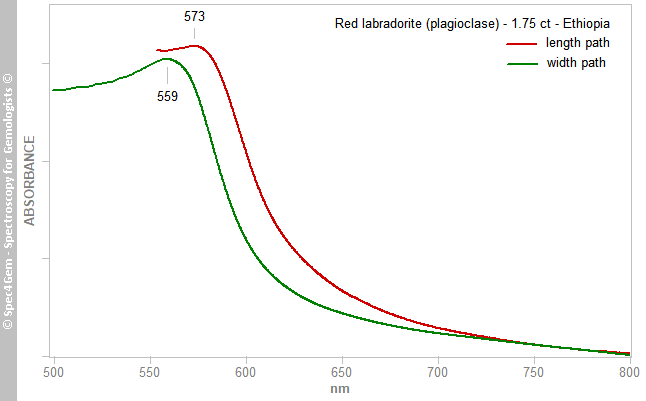 Figure 7. The oriented Vis spectra of the 1.75 ct red labradorite according to the length and with axis show a slight shift between the two directions that should result in a very weak pleochroism in the same hue (non-observable with optical dischroscopes).
Photoluminescence spectroscopy:
The photoluminescence spectra shown in Figure 8 were collected using three different excitations sources: 260, 310 and 405 nm. All three show an emission arround 705 nm that can be attributed to Fe3+ luminescence which is quite common in plagioclase. The 405 nm excitation induced two other emissions at 560 and 590 nm, the 560 nm emission can be attributed to Mn2+, common in plagioclase as the Fe3+ one. The 590 nm emission could also be ascribed to Mn2+, possibly in another site. All attributions can be verified in Gorobets et Rogojine, 2002[5].
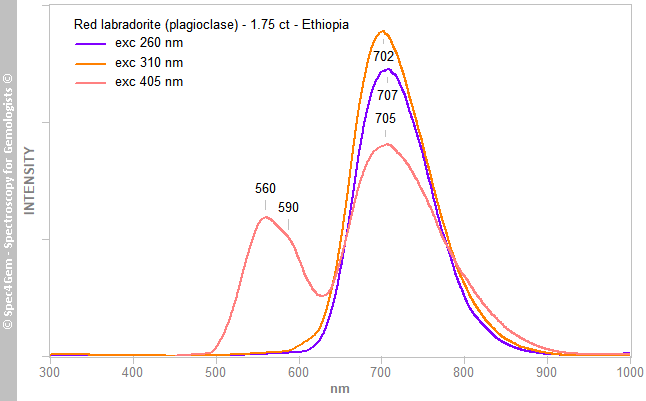 Figure 8. The photoluminescence spectra of the 1.75 ct red labradorite excited at 260, 310 and 405 nm show Mn2+ emissions at 560 and 590 nm and Fe3+ emission at 705 nm.
LA-ICP-MS analysis:
LA-ICP-MS analysis was performed on another gemstone from a parcel belonging to Thierry Pradat by the Laboratoire Français de Gemmologie, numeric results are summarized in Table 2. For each element, the average of the five spots was added to the table in order to plot the elements ratios as violet crosses in the graphs shown in Figure 9 (for convenience, the average was chosen instead of plotting the five spot data, the variance of the plotted elements is rather low). The graphs of the Figure 9 are reproduced from Z. Sun et al., 2020[1]. We can easily notice the results match the ratios of Ethiopian red labradorite. Of course, analysis was only on a single sample and we cannot provide the assurance that all the stones of the parcel are exactly similar, even for the gemstone studied here which is also issued from the same parcel.
| Element ↓ | Measure → | spot1 | spot2 | spot3 | spot4 | spot5 | Average of the 5 spots |
| Na | 28350 | 28346 | 28416 | 27721 | 27595 | 28086 |
| Mg | 323 | 322 | 335 | 325 | 325 | 326 |
| Al | 158902 | 160820 | 160915 | 168900 | 169194 | 163746 |
| Si | 246047 | 243188 | 243052 | 232491 | 232143 | 239384 |
| P | 12 | 22 | 18 | 24 | 17 | 19 |
| K | 664 | 662 | 650 | 658 | 658 | 658 |
| Ca | 90288 | 90064 | 90510 | 96427 | 96701 | 92798 |
| Cr | 3,7 | 3,2 | 2,1 | bdl | bdl | 2 |
| Fe | 2571 | 2575 | 2516 | 2499 | 2481 | 2528 |
| Cu | 36 | 36 | 35 | 29 | 28 | 33 |
| Ga | 18 | 18 | 17 | 16 | 17 | 17 |
| Sr | 270 | 270 | 281 | 302 | 299 | 284 |
| Ba | 16 | 16 | 17 | 17 | 17 | 17 |
Table 2. LA-ICP-MS numeric results of Thierry Pradat's sample provided to the L.F.G. for analysis.
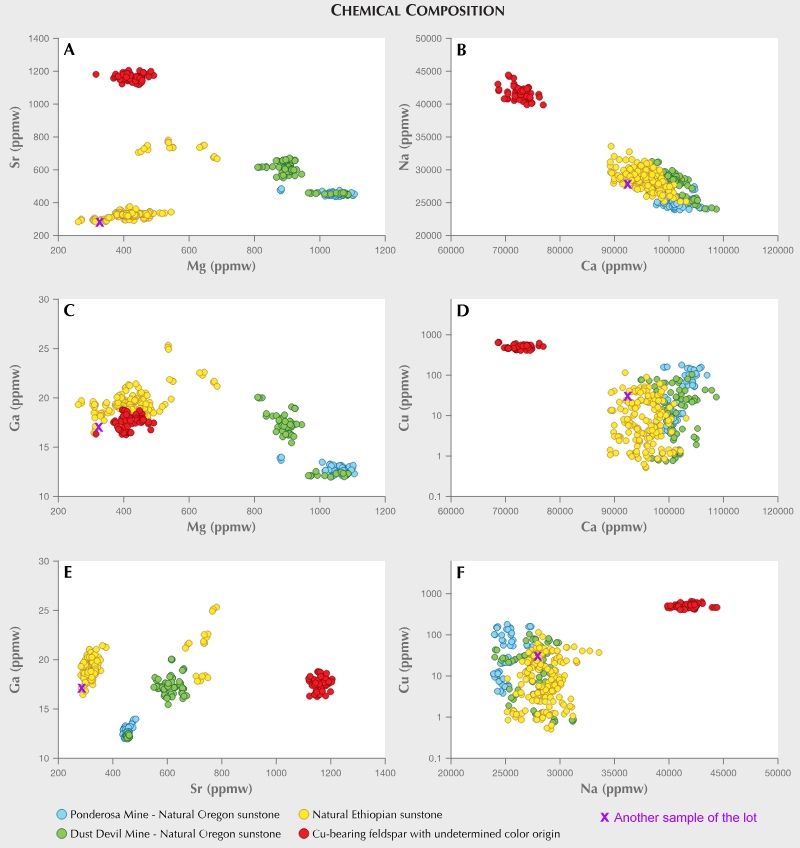
Figure 9. Elements ratio by LA-ICP-MS chemistry (Z. Sun et al., 2020) of copper-bearing plagioclases of different origins. The ratios of the
sample analysed by the L.F.G. are plotted as violet crosses. For each element ratio, the sample falls in Ethiopian ranges.
Conclusion:
All the analysis are consistent with Ethiopian labradorite, so we can safely be confident to assume this vivid red labradorite is from Ethiopia, unless similar undisclosed properties are found somewhere else.
[1] Sunstone plagioclase feldspar from Ethiopia, Ziyin Sun, Nathan D. Renfro, Aaron C. Palke, Heidi Breitzmann, Jonathan Muyal, Dylan Hand, Maxwell Hain, Shane F. McClure, Yusuke Katsurada, Makoto Miura, George R. Rossman, 2020, Gem News International, Gems & Gemology, 2020, Spring, 56(1), pp.184-188
[2] Exsolution of metallic copper from Lake County labradorite, A. N. Hofmeister and G. R. Rossman, 1985, Geology 13: 644-7
[3] Red and green labradorite feldspar from Congo, M. S. Krzemnicki, 2004, The Journal of Gemology, 29(1), pp. 15-23., 6(1), pp. 51-66
[4] Identification of Natural and Treated Red Feldspar, Namrawee Susawee and Chakkaphan Sutthirat, 2014, Bulletin of Earth Sciences of Thailand, 6(1), pp. 51-66
[5] Luminescent Spectra of Minerals, Boris S. Gorobets and Alexandre A. Rogojine, Moscow, 2002, ISBN: 5901837053, pp. 143-147

