
During the last 'Salon de minéralogie et bijouterie de Paris - Printemps 2015' in Paris in March 2015, few 'neon' green stones have got our attention since this color is not widely available in the market. They were displayed as tremolite from Tanzania, the main stone weighting 2.12 ct and the smallest one only 0.79 ct. Such a size and color for tremolite is uncommon or just let say exceptional. Tremolite has already been found in gem quality that produces quite clean faceted stones. These gemstones are produced from Merelani in Tanzania, where they are found with diopside of the same color with which they can be mistaken. Such material was first discovered or reported in 2007 and the details were published in 'Yellowish Green Diopside and Tremolite from Merelani, Tanzania' [1]. Such diopside was also described in french in 'Diopside vanadifère et/ou chromifère vert pomme de Tanzanie' [2].
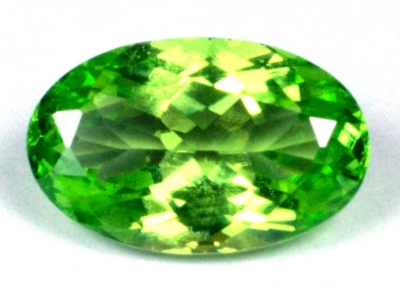 Figure 1: 2.12 ct yellowish green Cr,V diopside
The challenge was then to know if the presented material was tremolite or diopside. Mean refractive index is significantly higher for diopside (1.695) than for tremolite (1.618), as well as the mean specific gravity which is 3.30 for diopside against only 3.01 for tremolite. For both materials, visible spectra are quite similar and it is difficult - likely impossible - to make the difference with a common hand-held spectroscope whenever they are observables.
The properties of the 2.12 ct gemstone are summarized in table 1, those of the 0.79 ct one are identical.
| Shape | oval facetted |
| Size | 10.5 x 6.7 x 4.2 mm |
| Color | strongly yellowish green |
| Lustre | vitreous |
| Weight | 2.12 |
| SG | 3.24 |
| RI | 1.669 - 1.698 |
| DR | 0.029 B+ |
| Pleochroism | strongly yellowish green / yellow-green (no third color, color down to C-axis is slightly more saturated strongly yellowish green) |
| Polariscope / Conoscope | anisotrope, bi-axial |
| SWUV | weak chalky light greenish yellow |
| LWUV | inert |
| Magnetic susceptibility | none (N52) |
Table 1 : Observational and measured properties
Infrared reflectance spectroscopy:
The infrared reflectance spectrum was acquired from the table of the 2.12 ct stone which is large enough to get a good signal without any difficulty. Except if the stone was cut in a particular orientation of the crystal, the spectrum is to be considered as unoriented.
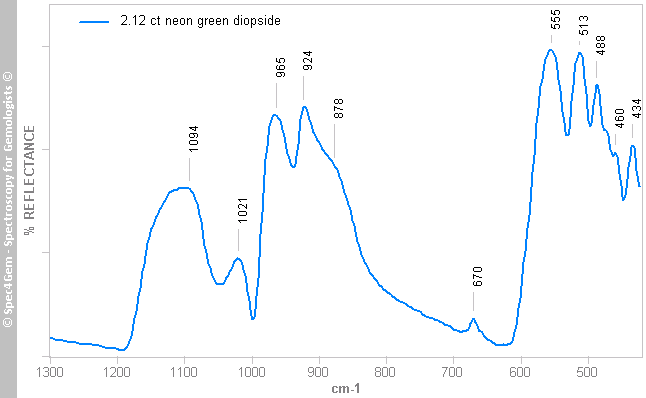 Figure 2: The 2.12 ct stone has an unoriented infrared reflectance spectrum which is diagnostic for diopside mineral specie.
The spectrum shown in figure 2 is typical and diagnostic of the diopside mineral specie.
UV-VIS-NIR spectroscopy:
Getting a reliable Uv-Vis-Nir spectrum from a faceted gemstone requires to find a light path in the stone. The retained solution is to use the girdle as entry and exit windows. Since optical axis have not been located in the faceted stone, the acquired spectrum is to be considered as unoriented.
The spectrum shows two main absorption regions located around 450 nm and 660 nm followed by a third one around 1060 nm as shown in figure 3. The first two ones have a FWHM of about 115 to 125 nm although the NIR one is much wider and flatter.
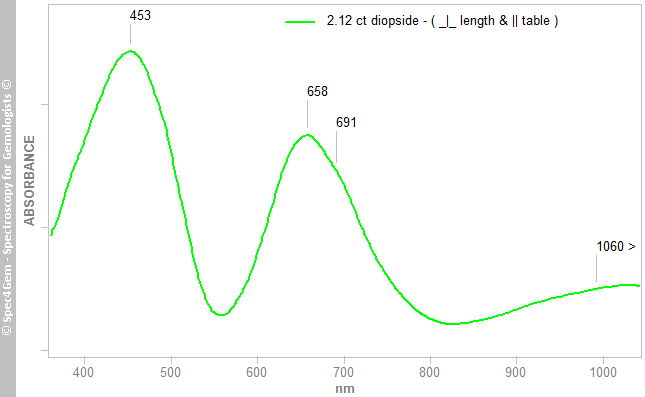 Figure 3: Unoriented Uv-Vis-Nir spectrum of the 2.12 ct stone.
Photoluminescence spectroscopy:
A 20 mW 405 nm laser was used to obtained the photoluminescence spectra shown in figure 4. Even, with such power, the photoluminescence phenomenon is rather weak but clearly shows two main emission peaks located around 585 nm and 775 nm. The intensity of the peaks of the spectrum identified by 'exc 405nm (ray || length) - 2.12 ct diopside' being rather weak compared to the other one, it is resized for easy reading. The peaks around 580 nm are narrow although the 770 nm peaks are much wider. In the 690 nm region there is a weak shoulder on the left side of the 770 nm emission peaks.
After Gorobets & Rogojine [3], the 580 nm emission peak in diopside photoluminescence is caused by the Mn2+ activator in M2 site replacing Ca2+ (CaVIII) and another emission peak located around 730 nm should be caused by the Fe3+ activator replacing Si4+. The 690 nm emission feature could possibly be assigned to Cr3+ and/or V2+. Usually, Cr3+ shows typical emission peaks with its particular shape at 684 nm and ~710 nm that cannot be recognized here. Another possible explanation to the later emission can be attributed the Mn2+ in M1 site replacing Mg (MgVI).
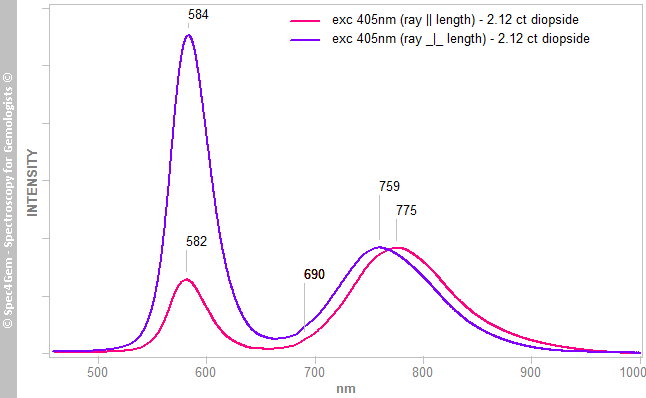 Figure 4: Photoluminescence spectrum of the 2.12 ct stone excited with a 405 nm laser source. Peaks around 580 nm and 770 nm are assigned to Mn2+ and Fe3+ respectively.
As the luminescence emission always occurs at lower energies than the energies that are required for excitation, using an excitation source at a given wavelength makes any absorption at a wavelength higher than that of the excitation source and lower to that of the emission peak a possible candidate as a cause for the emission.
As most of the absorptions of this diopside are located in the 400-500 nm and 600-700 nm ranges, using a 405 nm excitation source can bring to light that any of those energies absorptions are possible candidates for the emissions located above 700 nm.
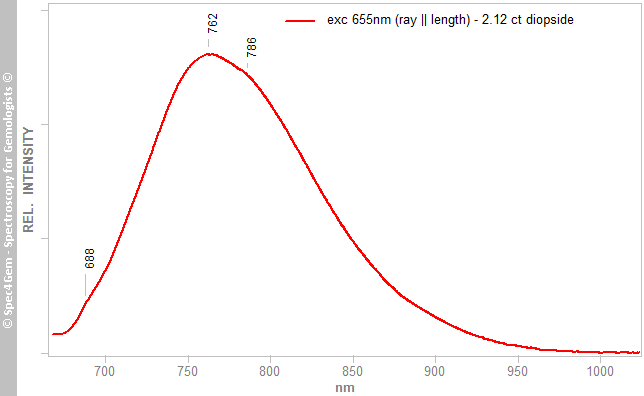 Figure 5: Photoluminescence spectrum of the 2.12 ct stone excited with a 655 nm laser source. It shows two main combined peaks located around 762 nm and 786 nm. A very weak shoulder on the left hand side of the main emission peak around 688 nm can be observed.
The 690 nm emission feature is also still noticeable with the 655 nm excitation.
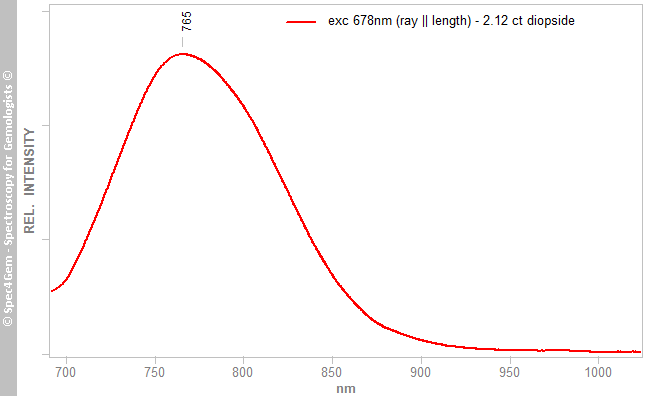 Figure 6: Photoluminescence spectrum of the 2.12 ct stone excited with a 678 nm laser diode source. The main emission peak is located around 765 nm.
Conclusion:
.
[1] Yellowish Green Diopside and Tremolite from Merelani, Tanzania - Eric A. Fritz, Brendan M. Laurs, Robert T. Downs, and Gelu Costin
[2] Diopside vanadifère et/ou chromifère vert pomme de Tanzanie - www.geminterest.com
[3] Luminescent Spectra of Minerals, Boris S. Gorobets and Alexandre A. Rogojine, Moscow, 2002, ISBN: 5901837053
[4] Luminescence Spectroscopy of Minerals and Materials, M. Gaft, R. Reisfeld, G. Panczer, Springer Editor, ISBN: 103540219188
[5] Le Diopside, P. Tahiri-Jouti, 2008, DUG Nantes
[6] Le vanadium trivalent (V3+) en tant que colorant dans les gemmes, E. Thoreux, 2011, DUG Nantes
[7] Mineralogical Applications of Crystal Field Theory, R. G. Burns, 2005, ISBN: 0521017858 | 978-0521017855
[8] Pyroxene Visible Spectra, CIT 7524 & RDS 62047-70 diopsides, California Institute of Technology