
Calcite exists in several colors like blue, brown, yellow, pink, colorless. This calcite weighting 3.03 ct was identified as aragonite which is another carbonate, the high pressure CaCO3 polymorph whereas calcite is the low pressure polymorph. Aragonite is thermodynamically unstable at standard temperature and pressure, and tends to alter to calcite on scales of 107 to 108 years.
This material with an orangish-brown color (honey color) comes from Erongo in Namibia which is well known for its gemstones (tourmaline, fluorite, topaz, spessartine garnet, ...).
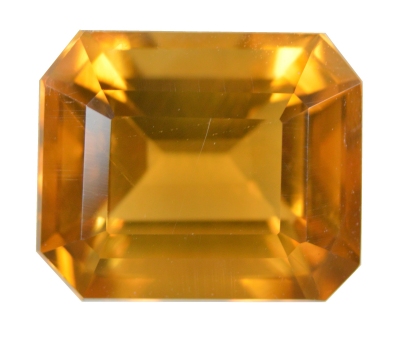 Figure 1. 3.03 ct orangish-brown calcite from Erongo, Namibia
| Shape | rectangle with corner facets step cut (emerald cut) |
| Size |
9.4 x 7.9 x 6.0 mm |
| Color | brownish-orange |
| Lustre | sub-vitreous |
| Weight | 3.03 ct |
| SG | 2.75 (Calcite: 2.66-2.75, Aragonite: 2.92-3.00) |
| RI | 1.488 - 1.659 (Calcite: 1.483-1.725, Aragonite: 1.528-1.692) |
| DR | 0.171 U- (Calcite: 0.165-0.195 U-, Aragonite: 0.145-0.155 B-) |
| Pleochroism | brownish-orange / light-brownish-orangish |
| Polariscope / Conoscope | light/dark 4 times / 360°, Uniaxial figure, C-axis || stone length |
| SWUV | white |
| LWUV | white (faint) |
| Magnetic susceptibility | inert |
Table 1. Observational and measured properties
Standard gemological tests (table 1) tends to indicate the material is rather a calcite than an aragonite.
Infrared reflectance spectroscopy:
Infrared reflectance spectrum (figure 2) was acquired from the gemstone table. It confirms the material is a carbonate and the unique reflectance band at 711 cm-1 is diagnostic of calcite, not aragonite which has a doublet at 700 and 711 cm-1, (see Differentiating aragonite from calcite by IR and Raman spectroscopy).
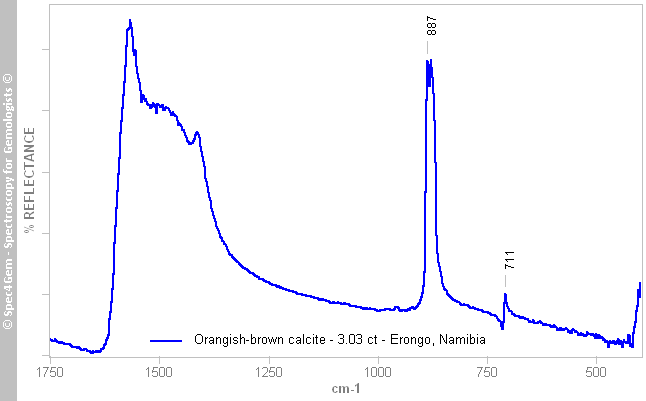 Figure 2. IR reflectance spectrum of the 3.03 ct orangish-brown calcite from Erongo, Namibia. The unique 711 cm-1 band is characteristic of calcite.
UV-VIS-NIR spectroscopy:
The UV-Vis-NIR spectrum (figure 3) was acquired with the light path crossing the stone from the culet to the table (ray light being _|_ to the table). The spectrum is composed of two main absorption in the UV and NIR, resulting in a transmission window between 500 and 900 nm.
The edge starting around 800 nm and extending toward the NIR is likely due to Fe2+ ion which is known in carbonates, the Fe2+ absorption bands are usually located around 1050 and 1300 nm [1]. On the other side, starting in the yellow-green around 600 nm, a strong absorption edge extends to the UV. Such a high energy feature usually indicates a charge transfer band that is likely caused by Fe2+ as well [2].
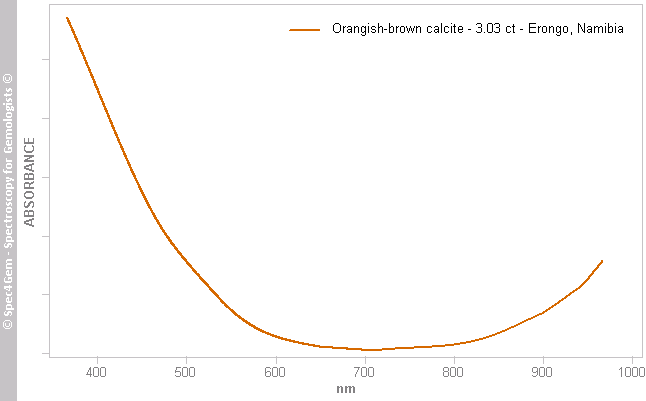 Figure 3. UV-Vis-NIR spectrum of the 3.03 ct orangish-brown calcite from Erongo, Namibia.
 Photoluminescence spectroscopy:
Photoluminescence spectra were acquired with three excitation sources, 405 nm (figure 5), 370 nm (figure 6) and 254 nm (figure 7). While observed with unaided eyes, the color of luminescence is almost white even if it is less evident with the 405 nm laser beam because the induced luminescence is only produced on the laser beam path and as it gets transmitted by the stone, thus filtered by the stone, it gets colored like the stone.
Three spectra were acquired using the 405 nm excitation laser, the laser beam was oriented as indicated in figure 4 and was parallel to the girdle plane. The light of the 254 and 370 nm sources was directed on the culet
All spectra acquired with the 405 nm (figure 5) present the same emission pattern with a large emission approximately centered between 550 and 580 nm. The large emission is possibly composed of or overlaid by emission peaks at 524, 556, 591 and 634 nm. The spectra slighly differ because of the peaks intensities although the peaks locations are the same.
Similar peaks are observed in the 370 and 254 nm photoluminescence spectra respectively in figure 6 and 7. The peaks positions are 525, 570, 590 and 625 nm with the 370 nm excitation and 525, 557, 590 and 630 nm with the 254 nm excitation source. Spectra shapes are similar to that of the 405 nm excitation spectra with a wide emission centered at 560 nm (370 nm excitation) and 545 nm (254 nm excitation).
The light polarization has an impact on absorption spectra in anisotropic materials, the luminescence spectra are impacted in the same way. This probably explains the differences observed in the three spectra obtained with the 405 nm excitation source since they were acquired from three distinct light orientation in the stone.
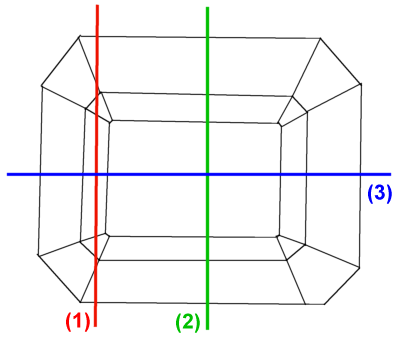 Figure 4. The three directions of the 405 nm laser beam used
to acquire photoluminescence, the beam crossed the stone
at the girdle’s level.
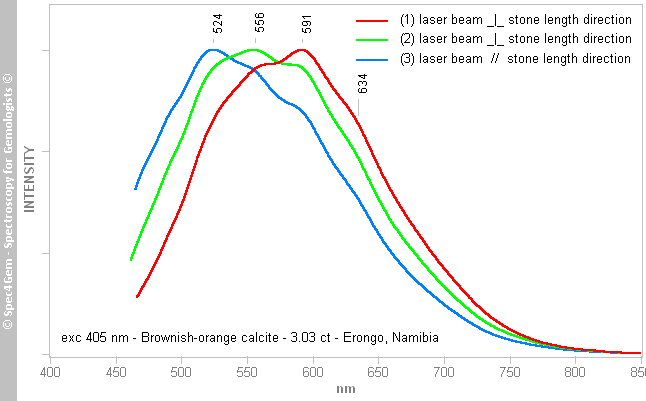 Figure 5. 405 nm excitation photoluminescence spectrum of the 3.03 ct orangish-brown calcite from Erongo, Namibia. The spectrum pattern is a large emission centered between 550 and 580 nm with overlaying peaks at 524, 556, 590 and 634 nm.
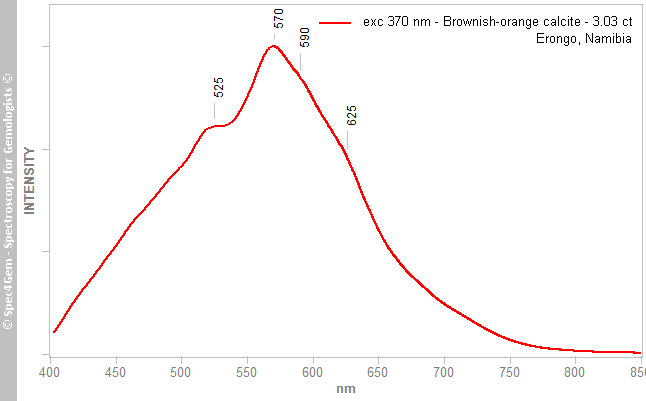 Figure 6. 370 nm excitation photoluminescence spectrum of the 3.03 ct orangish-brown calcite from Erongo, Namibia. The spectrum pattern is a large emission centered near 560 nm with distinct overlaying emission peaks at 525, 570, 590 and 625 nm. Observed luminescence is almost white and moderate.
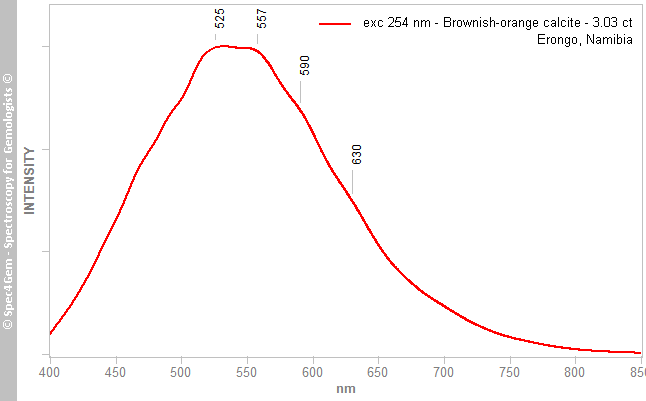 Figure 7. 254 nm excitation photoluminescence spectrum of the 3.03 ct orangish-brown calcite from Erongo, Namibia. The spectrum pattern is a large emission centered near 545 nm with distinct overlaying emission peaks at 525, 557, 590 and 630 nm. Observed luminescence is almost white but much stronger than the one observed with the 370 nm excitation.
After Tarashchan 1978, such a large green emission band is linked to organic molecules (not with uranyl), Gorobets and Rogojine Fig 7.9 L13 p.116[3]. Even if it was described as a large green emission it is merely a white luminescence due to the wideness of the emission. Effects of light polarization are rarely described in the literature, that is even more true while organic molecule are the cause of the luminescence. Any related information is welcome.
Additional tests could be performed to check whether such luminescence is only attributed to organic molecules or not. Organic molecules luminescence has a short lifetime whereas Mn2+ or REE luminescences have longer lifetime.
Conclusion:
This gemstone material presented as aragonite does not match the aragonite properties (table 1) but that of calcite. IR reflectance spectroscopy (figure 2) confirmed the material to be the calcite. The honey color of the material is most likely due to Fe2+ iron and luminescence connected to organic molecules.
[1] Caltech - Carbonate Group Visible Spectra (350 - 1100 nm)
[2] Spectral reflectance of carbonate minerals in the visible and near infrared (0.35-2.55 microns): calcite, aragonite, and dolomite, Susan J. Gaffey, American Mineralogist, Volume 71, pages 151-162, 1986
[3] Luminescent Spectra of Minerals, Boris S. Gorobets and Alexandre A. Rogojine, Moscow, 2002, ISBN: 5901837053