
A small mint-green chrysoberyl, figure 1, was sold as a vanadium-bearing chrysoberyl because of its Tanzanian provenance. Vanadium, chromium / vanadium -bearing chrysoberyls have been found in Tanzania, Madagascar, Sri Lanka and Burma. Synthetic vanadium -bearing chrysoberyls do exist, but they are mainly used as the chrysoberyl variety 'alexandrite' known for its significant color-change.
Is this stone with an interesting mint-green color a vanadium -bearing chrysoberyl? Classical gemology cannot answer to the question. Spectroscopic study in the visible spectrum can help to find some answers but it is not fully diagnostic. V3+ (3d2) is not iso-electronic with Cr3+ (3d3) but as they quite similar, where chromium enters a crystalline structure, vanadium does enter as well, usually with energy levels that slightly differ.
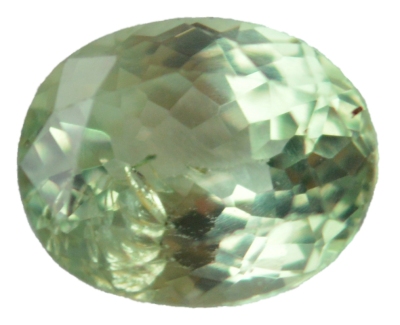 Figure 1. 0.71 ct 'mint-green' chrysoberyl from Tanzania
in cloudy natural daylight
| Shape | oval |
| Size | 5.8 x 4.7 x 3.0 mm |
| Color | grayish-yellowish-green (mint-green) |
| Lustre | bright vitreous |
| Weight | 0.71 ct |
| SG | 3.55 |
| RI | 1.744 - 1.752 |
| DR | 0.008 biaxial + |
| Pleochroism | light bluish-green | light brownish/greenish yellow | third color could not be observed |
| Polariscope / Conoscope | anisotropic, bi-axial interference figure observed through facets close to girdle with the stone oriented table and width perpendicular to polariscope filters |
| SWUV | inert |
| LWUV | inert |
| Magnetic susceptibility | inert (N52) |
Table 1. Observational and measured properties
UV-VIS-NIR spectroscopy:
The chrysoberyl being a bi-axial material, we could expect a trichroic stone with three light polarizations. A first spectrum, figure 2, was acquired regardless of polarization, simply with a light path perpendicular to the table, from the culet to the table. This spectrum shows an absorption continuum increasing in the violet and ultra-violet region. Three sharp and rather strong absorption bands are located in the ultra-violet, violet and blue region respectively at 367, 375 and 440 nm. These features are well known and are attributed to Fe3+ causing the yellow color of chrysoberyl, E.F. Farrell and R.E. Newnham [1]. The shape of the spectrum between the 375 and 440 nm Fe3+ bands suffers an anomaly because of its 'flatness' especially between 400 and 425 nm. This characteristic is likely the result of another absorption band around 415-420 nm hidden by the surrounding Fe3+ bands. The greenish-yellow, yellow and orange region of the spectrum shows a large band centered at 586 nm which is much weaker than those of Fe3+. In the red region, three distinctive small features at 646, 656 and 681 nm are commonly assigned to Cr3+.
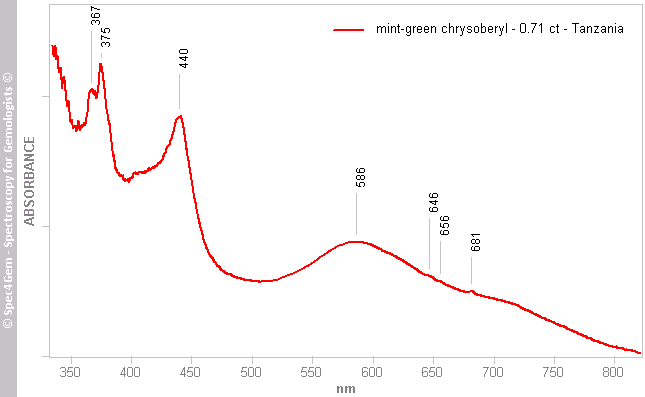 Figure 2. Unpolarized UV-Vis spectrum acquired with a light path from the culet to the table showing absorption features attributed to Fe3+ (367, 376 and 440 nm) and Cr3+ with a main band at 586 nm along with additional features at 646, 656 and 681 nm.
The large band around 586 nm is identified as the ν1 band and the 'hidden' one around 415-420 nm is identified as ν2. These bands are usually attributed to Cr3+ and/or V3+ in the chrysoberyl structure replacing Al3+. The replacement occurs in two distinct Al sites. Differentiating Cr3+ from V3+ has been studied by few authors especially by Dr K. Schmetzer et al. (2013)[2]. According to their study, the most evident spectroscopic feature is the shift of the unpolarized ν1 absorption band from 606-608 nm for [V-bearing, Cr-free] chrysoberyl to 573-576 nm [V-free, Cr-bearing] chrysoberyl. The unpolarized ν1 band measured for the current sample is about 586 nm that would indicate a significant Cr3+ content. However the absorption spectrum in figure 2, does not match those of Dr K. Schmetzer for the chrysoberyls originating from Tunduru, Tanzania. The current sample has Fe3+ features which are quite prominent and the main discrepancy is about the V3+/Cr3+ features which do not occupy the same spectral range, v1 band centered at about 586 nm against 598-608 nm for Tunduru samples.
Figure 3 shows the polarized spectra of the sample, polarization not set as a particular direction but simply to get the minima and maxima positions of the ν1 band. As the unpolarized spectrum, the current sample differs significantly from the Tunduru 1 & 5 samples of the study just quoted. Here again the ν1 bands are shifted to lower wavelength, confirming the observation of the unpolarized spectrum (anyway unpolarized ν1 should be in between ν1 minimum and maximum). Table 2 summarizes the UV-Vis absorption bands assignments with their identified cause for both polarized and unpolarized spectra.
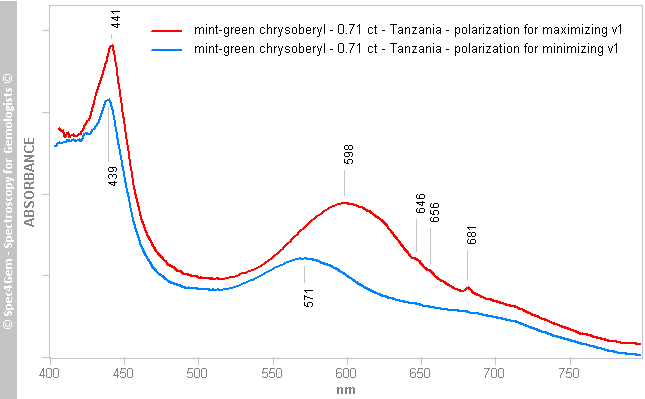 Figure 3. Polarized Vis spectra acquired to get the ν1 minimum and maximum, the UV region (<400 nm) was discarded because of the polarizing filter constraints and 'ν1 maximum' spectrum was shifted for clarity. The Fe3+ absorption around 440 nm is not (or very slightly) affected by light polarization. The ν1 band ranges from 571 to 598 nm and the 646, 656, 681 nm Cr3+ features are only observed in the 'ν1 maximum' polarization spectrum.
 | Band (nm) | Cause | References | ||
| Without Polarization | Polarization 'ν1 min' |
Polarization 'ν1 max' |
||
| 367 | Fe3+ | [1] | ||
| 375 | Fe3+ | [1] | ||
| ~415-420 | Cr3+ and / or V3+ replacing Al3+ in Al site (ν2) | |||
| 440 | 439 | 441 | Fe3+ | [1] |
| 586 | 571 | 598 | Cr3+ and / or V3+ replacing Al3+ in octahedrally coordinated sites II+I (ν1) | |
| 646 | 646 | Cr3+ vibronic transition line (S line) | ||
| 656 | 656 | Cr3+ vibronic transition line (S line) | ||
| 681 | 681 | Cr3+ R lines | ||
Table 2. UV-Vis absoption bands assignments
Photoluminescence spectroscopy:
A rapid check with a 405 nm laser pointer shows a moderate to strong red luminescence, such luminescence is known for chrysoberyl and usually attributed to Cr3+ and V3+ as described by Gaft et al [7] even if Gaft sometimes referred to V2+. An unpolarized 405 nm laser source was used to acquire the photoluminescence spectrum as shown in figure 4, unpolarized excitation can lead to slight discrepancies in the emission peak position, this is not an issue for the current analysis.
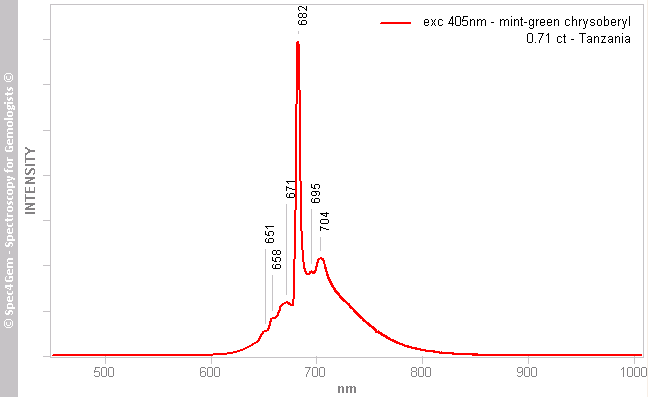 Figure 4. Unpolarized 405 nm excitation luminescence spectrum of the chrysoberyl sample showing the 651, 658, 671, 682, 695 and 704 nm emission peaks, characteristic of Cr3+ within the chrysoberyl structure.
The moderate to strong red luminescence of the current sample of chrysoberyl is as expected a Cr3+ luminescence as demonstrated by Gaft et al. [7]., Gorobets and Rogojine [6]. The main 682 nm emission peak is attributed to Cr3+ replacing Al3+ in octahedrally coordinated reflection site II and the weak 695 nm emission peak is attributed to Cr3+ replacing Al3+ in octahedrally coordinated inversion site I.
Even if the luminescence spectrum is rather unambiguous, the V3+ luminescence spectrum of a V-bearing chrysoberyl is shown in figure 5 for comparison, source Gaft et al. [7]. Such emission spectrum is characteristic with its 689, 698, 702 and 717 nm emission peaks and its overall 'shape'. Note that the tsavorite garnet (vanadium-bearing) shows an identical emission spectrum. As above mentioned the sample does not show any of the V3+ emission features. Could the V3+ emissions be hidden / masked / obfuscated by the Cr3+ emissions? This is likely improbable but without anymore V-bearing chrysoberyl samples it is definitely impossible to confirm that point.
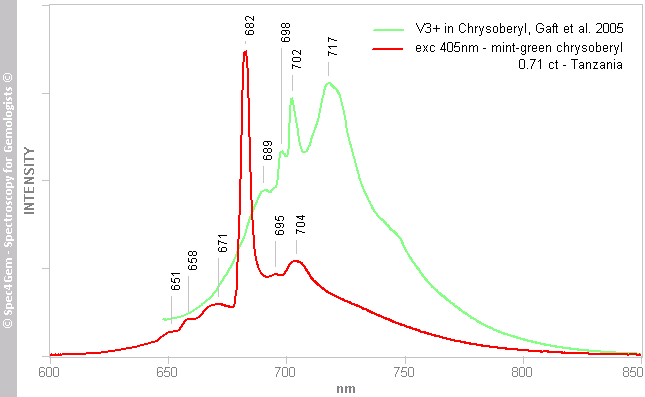 Figure 5. Unpolarized 405 nm excitation luminescence spectrum of the chrysoberyl sample as shown in figure 4 compared to the steady-state luminescence spectrum of V3+ in chrysoberyl with its own characteristic 'signature' showing the 689, 698, 702, and 717 nm emission peaks.
Conclusion:
The UV-Vis spectroscopic study of this 'mint-green' chrysoberyl sample revealed this sample owes its color to Fe3+ and Cr3+/V3+ with a significant Cr3+ concentration compared to V3+ because of the position of the ν1 absorption band. The presence of V3+ could not be definitely demonstrated with the photoluminescence spectroscopy although there is no doubt about that of Cr3+. Vanadium could be present in the sample but if it was the case, it would be at low concentration level compared to that of Cr3+. Therefore it is unrealistic to state this chrysoberyl sample is a vanadium-bearing chrysoberyl, it simply owes its color to the iron and chromium chromophores.
[1] Crystal-field spectra of chrysoberyl, alexandrite, peridot and sinhalite, E. F. Farrell and R. E. Newnham, American mineralogist,1965, Vol. 50, 1965, pp. 1972-1981
[2] Natural and synthetic vanadium-bearing chrysoberyl, Karl Schmetzer, Michael S. Krzemnicki, Thomas Hainschwang and Heinz-Jürgen Bernhardt, The Journal of Gemmology, 2013, Volume 33 No. 7–8, p 233
[3] Synthetic alexandrites grown by the HOC method in Russia: internal features related to the growth technique and colorimetric investigation, Dr Karl Schmetzer, Dr Heinz-Jürgen Bernhardt, Walter A. Balmer and Thomas Hainschwang, The Journal of Gemmology, 2013, Volume 33 No. 5–6, p. 113
[4] Titanium-bearing synthetic alexandrite and chrysoberyl, Dr Karl Schmetzer, Dr Heinz-Jürgen Bernhardt and Thomas Hainschwang, The Journal of Gemmology, 2013, Volume 33 No. 5–6, p. 137
[5] Flux-grown synthetic alexandrites from Creative Crystals Inc, Dr Karl Schmetzer, Dr Heinz-Jürgen Bernhardt and Thomas Hainschwang, The Journal of Gemmology, 2012, Volume 33 No. 1–4, p. 49
[6] Luminescent Spectra of Minerals, Boris S. Gorobets and Alexandre A. Rogojine, Moscow, 2002, ISBN: 5901837053
[7] Luminescence Spectroscopy of Minerals and Materials, M. Gaft, R. Reisfeld, G. Panczer, Springer Editor, ISBN: 103540219188