
Since 2014 spring, new light blue sapphires have been available in the market. They are mined from a new deposit nearby the Guroji village located on Mambilla plateau in Taraba state, Nigeria.
This area is already well known for its dark blue sapphires but the new deposit produces sapphires of another kind of color since these new gemstones are light blue with a particular brightness.
Prices have quickly risen to some heights making the stone difficult to find at affordable price. This report is about the only one sample got from this deposit and it concerns a 5.06 ct rough as presented on photo 1.
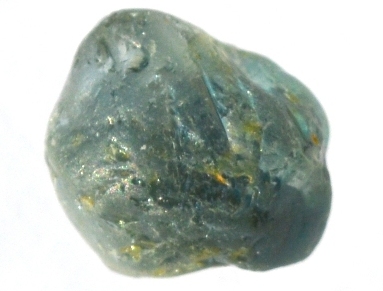 Photo 1: Mambilla rough sapphire, 5.06 ct
| Size | 10 x 8 x 7 mm |
| Color | light blue |
| Lustre | bright vitreous |
| Weight | 5.06 ct |
| SG | 3.95 |
| RI | not mesured |
| DR | not mesured |
| Pleochroism | light blue / nearly grayish colorless to very light grayish blue |
| Polariscope / Conoscope | dark/light every 90° / uniaxial |
| SWUV | inert |
| LWUV | inert |
Table 1 : Observational and measured properties
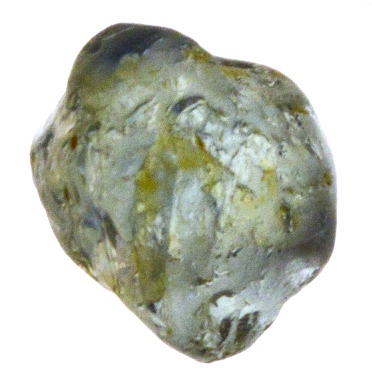 Photo 2a: Color in transmitted light 6500°K
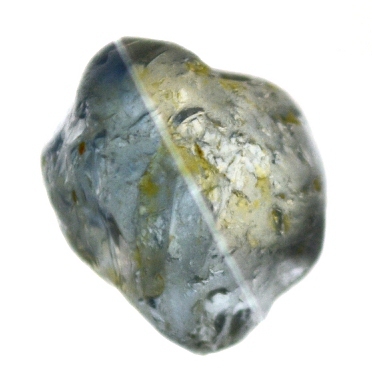 Photo 2b: The two pleochroic colors in transmitted light 6500°K
UV-VIS-NIR spectroscopy:
Two absorption spectra were acquired to get polarized spectra associated to the two rays (ordinary and extra-ordinary) of the uniaxial crystal. The electomagnetic spectrum ranges from the ultra-violet starting at 360nm up to the near infrared about 1100nm.
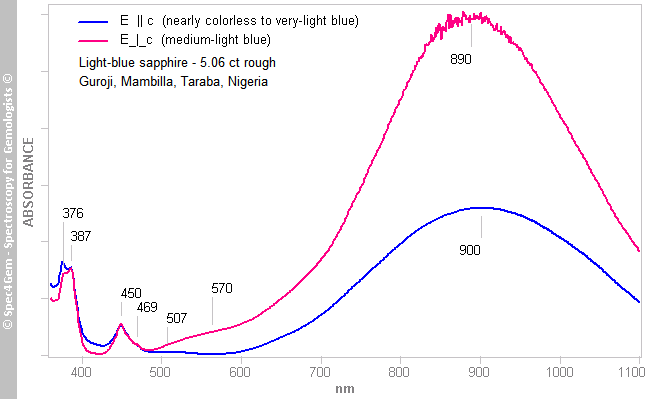
Figure 1 : Polarized UV-VIS-NIR absorption spectra of the 5.06 ct Mambilla rough sapphire. The spectra labelled E_|_c and E||c are respectively the ordinary ray (light blue) and the extra-ordinary ray (nearly-colorless to very light blue).
The strong and broad absorption band around 900 nm is characteristic of corundum of magmatic origins. The large band centered around 570 in the ordinary ray (E_|_c) absorbs the green, the yellow and a part of the red and thus gives the light blue color to this sapphire. The extra-ordinary (E||c) misses such absorptions since the corresponding band is very week and centered around 507nm. Therefore, as the green, yellow and the red in a weaker manner are less absorbed, the color is almost colorless to very light blue. This difference between the two absorption spectra is the cause of the well observed pleochroism through the different direction of the crystal in this rough.
The band positions, let say the absorption peaks, are calculated from the experimental data by a process of curves-fitting. Gaussian curves are used in conjunction with the Levenberg-Marquardt algorithm applied to a least square regression.
The peak positions obtained from this fitting process are enumerated in the table 2. The attribution of these peaks / bands is established from the existing literature.
|
E_|_c (nm/cm-1) |
E||c (nm/cm-1) |
Description | Origin / Cause |
| 376 / 26596 | 378 / 26428 | narrow band | v54E(4D) Fe3+ in C3 |
| 386 / 25877 | 387 / 25840 | narrow band | v44T2(4D) Fe3+ in C3 |
|
449 / 22275 450 / 22228 |
449 / 22282 450 / 22198 |
this band shape cannot be described by only one gaussian because of its particular shape, but preferably to the superposition of two close gaussians, one being much wider than the other one |
spin-forbidden transitions : 6A1 → 4A1,4E(G) and 6A1 → 4A2,4E(D) of the Fe3+ ion in octahedral coordination, intensified by the exchange interactions with the adjacent Fe3+ ions pairs - v34E4,A1(4G) Fe3+ in C3 |
| 469 / 21335 | 471 / 21227 | thin band of weak absorption located on the right hand side of the 450 nm | ? |
| 507 / 19720 | large band of weak absorption only observed in the extra-ordinary ray (E||c) | (Fe2+ → Ti4+ CT charge transfer across the edge-shared octahedron) | |
| 570 / 17543 | large band of moderate absorption only observed in the ordinary ray (E_|_c) | Fe2+ → Ti4+ CT charge transfer across the edge-shared octahedron | |
| 890 / 11236 | 900 / 11111 | strong and large band | Fe2+ CF crystal field transitions replacing Al3+ |
Table 1: List of the absorption bands according to the polarized ray and their attribution.
Photoluminescence spectroscopy:
The photoluminescence is obtained by an excitation source at 405 nm (LED laser 20 mW). Despite the power delivered by such a excitation source, the signal remains rather weak and the phenomena cannot be observed with the naked eye.
The spectrum of this Mambilla sapphire illustrated in figure 2 shows a typical emission spectrum caused by the Cr3+ ion in the corundum structure.
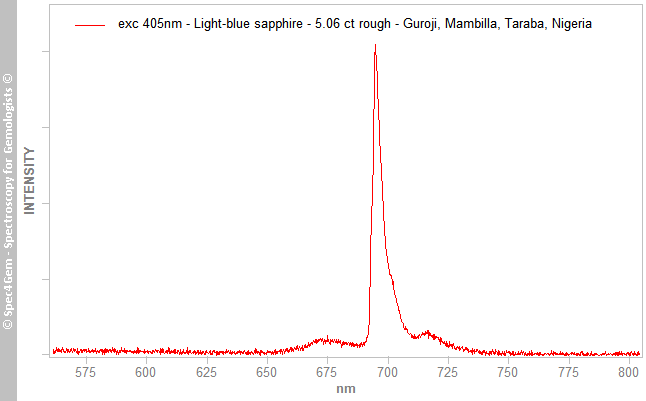
Figure 2: Photoluminescence spectrum obtained with a 405 nm excitation.
The main peak located at 694.2 nm is the well-known R1 line of the R1/R2 lines doublet of the Cr3+ in corundum. The curve fitting process gives 694.2 nm et 692.8 nm, respectively R1 and R2 lines, spaced of 1.4 nm. It is not clear if the 700nm features is caused by the N1 and N2 lines. Usually, these lines are of a very weak intensity compared to the R1 and R2 ones while observed at room temperature (~20°C). The other side-bands are also present.
Chromium as Cr3+ ion is thus present in this sapphire sample, spotted by its photoluminescence. Nevertheless it does not clearly appear in the absorption spectra except in the 470 nm band, that is to be confirmed, the concentration is likely to weak.
In the study driven by the GIA team of Bangkok [1], the chemistry analysis using LA-ICP-MS points out that chromium is below the quantification level for 3 of the 12 samples and below the detection limit for the 9 others.
Discussion:
As a result of the study of the photoluminescence of the sample of the Mambilla rough sapphire analyzed in the present report, it is obviously impossible to generalize or to conclude that chromium is present in all the sapphires of this Mambilla new deposit. Anyway, even this is possible, the chromium has no impact on the color of these sapphires.