
In the late 2013, so particular greenish-blue kyanite appeared in the market, reportedly coming from the Odisha state of India (the former Orissa indian state).
The kyanite (figure 1) has an unusual greenish-blue color which is uncommon for blue kyanite. Its color is similar to that of a 3.91 ct kyanite cab of unknown locality seen in early 2009. The gemstone is surprising red viewed through the chelsea filter.
The gemstone is included and hosts undefined forms of black mineral inclusions and several kind of colorless / white crystals.
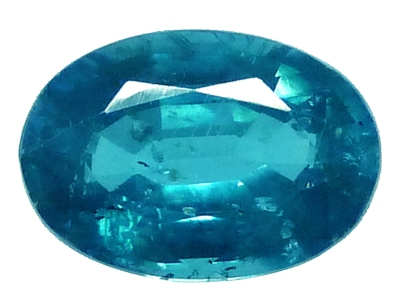 Figure 1. 3.70 ct greenish-blue kyanite from Orissa state, India. The
color is that observed in daylight or artificial cool white light.
| Shape | oval |
| Size | 11.4 x 8.0 x 5.0 mm |
| Color | greenish-blue in daylight to grayish-blue in incandescent (halogen) light, red viewed with chelsea filter |
| Lustre | vitreous |
| Weight | 3.70 ct |
| SG | 3.73 |
| RI | 1.715 - 1.731 |
| DR | 0.016 (looks uniaxial positive from the table) |
| Pleochroism | greenish-blue / very light grayish-blue (observed in cool light) |
| Polariscope / Conoscope | anomalous stain pattern observed through table, light/dark 4 times / 360° in other directions, two optic axis can be observed on each end of the stone but biaxial interference figure cannot be observed |
| SWUV | inert |
| LWUV | inert |
| Magnetic susceptibility | very weak with N52 |
Table 1. Observational and measured properties
Infrared reflectance spectroscopy:
The IR reflectance spectrum (figure 2), acquired from the gemstone's table, exhibits a characteristic spectrum of kyanite specie.
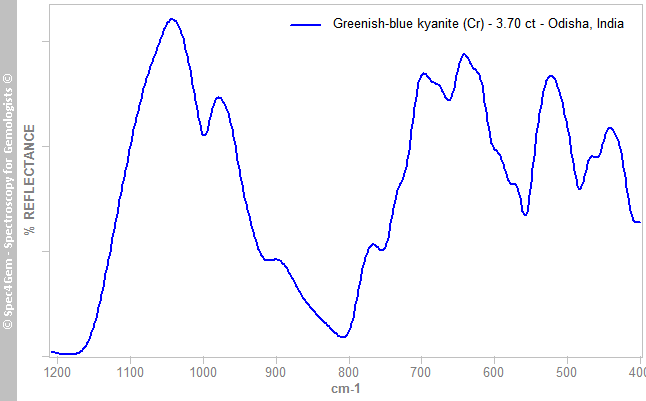 Figure 2. IR reflectance spectrum of the 3.70 ct greenish-blue kyanite from Odisha, India, acquired from the gemstone 's table, exhibits a characteristic spectrum of kyanite specie.
 UV-VIS-NIR spectroscopy:
The UV-Vis-NIR absorption spectrum (figure 3) was acquired with the light path perpendicular to the table, the light entering the pavilion at the culet point. This unpolarized UV-Vis-NIR absorption spectrum exhibits sharp and distinct absorption bands located at 379, 431 and 444 nm with 'shoulders' at 415 and 461 nm. A large and strong band around 604 nm accompanied by a shoulder at 580 nm is decorated with weaker but quite distinct bands at 651, 670, 690 and 709 nm. The NIR range does not show significant features.
A gaussian fitting gives a possible configuration with main bands at 415, 580 and 625 nm besides the Fe3+ related bands at 379, 431 and 444 nm (Faye and Nickel, 1969)[2], (Parkin et al., 1977)[1]. The Fe3+ CF transitions are also responsible for a large absorption band in the 590-625 nm region (Faye and Nickel, 1969)[2] generally observed in green kyanite, therefore the 604 nm band could be attributed to Fe3+ but the Fe3+ band is usually larger and flatter than the very strong one observed in this greenish-blue kyanite.
Kyanite's blue color is known to be caused by the Fe2+↔Ti4+ IVCT (White and White, 1967 - Parkin et al, 1977 - Ghera et al, 1986)[1] or by the now prefered Fe2+↔Fe3+ IVCT (Faye and Nickel, 1969)[2], (Smith and Strens, 1976 - Burns, 1981)[1] which produces a large absorption extending from 580 to almost 900 nm because of the Fe2+ CF transitions absorption band in the 800-850 nm region (Faye and Nickel, 1969)[2]. The later is missing in the spectrum of this greenish-blue kyanite although it should exist in all three polarized spectra, thus it can be safely assume that Fe2+ is not present or present in such concentration it does not affect the absorption spectrum. From that, the 600 nm major band cannot be attributed to the Fe2+↔Fe3+ IVCT nor to the Fe2+↔Ti4+ IVCT that both produce the same absorption spectrum pattern in the 580 - 1000 nm region.
Weak features present at 651, 670, 690 and 709 nm are unambiguously attributed to Cr3+, rising the question about the contribution of the Cr3+ in the spectrum, especially since there is a possible band around 415 nm. The two main Cr3+ absorption bands in kyanite are located around 415 and 580-630 nm. Cr3+ contribution to the blue kyanites spectra has been studied by K. Langer with synthetic Cr3+ kyanites[4] and also discussed by Faye and Nickel, 1969[2] and Bosshart et al.[3].
There are few doubt about the real and main contribution of Cr3+ to the UV-Vis absorption spectrum of this particular greenish-blue kyanite from Odisha, India with its so particular color. In comparison, the Caltech's Cr-kyanite sample GR1692 from Kenya[4] shows a spectrum which is quite similar to that of the present sample of the greenish-blue kyanite from Odisha, India.
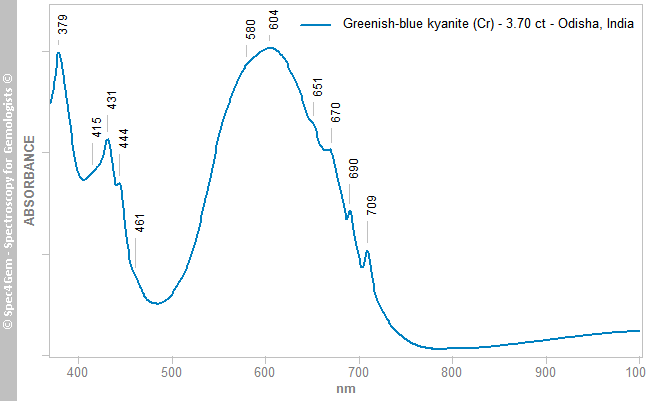 Figure 3. Unpolarized UV-Vis-NIR absorption spectrum of the 3.70 ct greenish-blue kyanite from Odisha, India exhibiting absorption features on the whole visble range. Sharp and distinct absorption bands are located at 379, 431 and 444 nm with shoulders at 415 and 461 nm. A large and strong band around 604 nm accompanied by a shoulder at 580 nm is decorated with weaker but quite distinct bands at 651, 670, 690 and 709 nm. The NIR range does not show significant features. The UV and violet bands (379, 431 and 444 nm) are unambiguously related to Fe3+. The 415, possibly the 461, and the 580, 604, 651, 670, 690, 709 nm bands are attributed to Cr3+ with a possible contribution of Fe3+ in the 580-604 nm band.
 Two more spectra were acquired with a polarizing filter that has a limited transmission bandwidth (420 - 800 nm) and the light path as for the unpolarized spectrum. Therefore the unpolarized spectrum should be an intermediate spectrum having features of both polarized spectra except if the unpolarized one was already matching one of these polarization directions. The collected spectra (figure 4) correspond to the E||γ and E||β polarization directions. The Fe3+ doublet at 434 and 446 nm is mostly invariable except its absorbance is greater in E||γ direction than in E||β one. The evident Cr3+ features at 653, 670, 691 and 710 nm also depends on polarization, they are stronger in E||γ direction than in the E||β one. The strong band at 604 band in the unpolarized spectrum appears to be the sum of at least two bands centered at 575-585 and 620-630 nm confirming the hypothesis of multiple bands calculated by the gaussian fitting.
These polarized spectra are similar in all points to the Caltech's Cr-kyanite sample GR1692 from Kenya[5]. The spectrum is the spectrum of a Cr3+ kyanite with significant Fe3+ content.
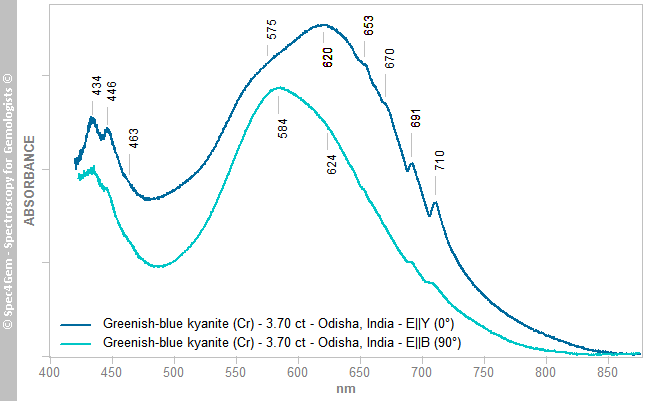 Figure 4. Polarized Vis absorption spectrum (E||γ and E||β directions) of the 3.70 ct greenish-blue kyanite from Odisha, India. As for unpolarized spectrum, Fe3+ absorption features are located at 434, 446 nm. The weak shoulder at 461 nm is also present. The main absorption band at 580-604 is now split in two bands at 675-585 and 620-624 nm. The additional Cr3+ bands are present at 653, 670, 691 and 710 nm with a prominence in the E||γ spectrum.
 Photoluminescence spectroscopy:
The photoluminescence is rather strong with a 405 nm laser, even with a simple 1mW laser pointer. The 405 nm excitation photoluminescence spectrum (figure 5) was acquired without taking care about any orientation / polarization.
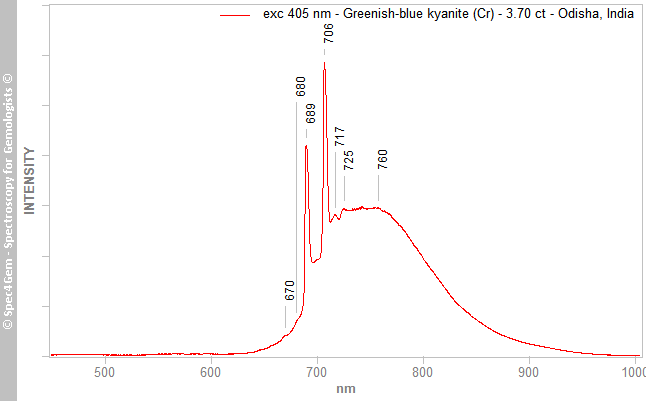 Figure 5. Photoluminescence spectrum of the 3.70 ct greenish-blue kyanite from Odisha, India showing the R2 & R1 Cr3+ lines respectively at 689 and 706 nm in reaction to the 405 nm excitation. The 760 nm large emission peak is also attributed to another Cr3+ emission center.
This greenish-blue kyanite shows a really strong red luminescence attributed to Cr3+ with its so characteristic R2 and R1 lines respectively at 689 and 707 nm (Gaft et al.)[6] associated with Cr3+ in site A. The 760 nm large emission peak is also attributed to another Cr3+ emission center (Gaft et al.)[6] associated with Cr3+ in site B. This second emission center at 760 nm becomes more intense than the first one when excitation changes from 405 nm to 635 nm and even 678 nm, see the spectrum of figure 6 for the luminescence excited by the 635 nm laser. This suggests that absorption in the 635 nm region is linked to the Cr3+ in site B. With the 678 nm excitation, the 760 / 767 nm emission center is dominant and prevails on the 707 nm peak which is just visible (figure 7).
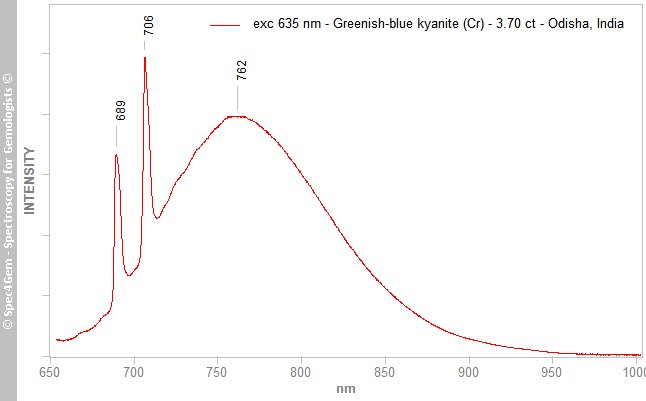 Figure 6. Photoluminescence spectrum of the 3.70 ct greenish-blue kyanite from Odisha, India excited by the 635 nm laser. Besides the Cr3+ R lines respectively at 689 and 706 nm (emission center associated to Cr3+ in site A), the 762 nm large emission band attributed the Cr3+ emission center linked to Cr3+ in site B becomes more prominent. The laser beam is oriented perpendicular to the stone length.
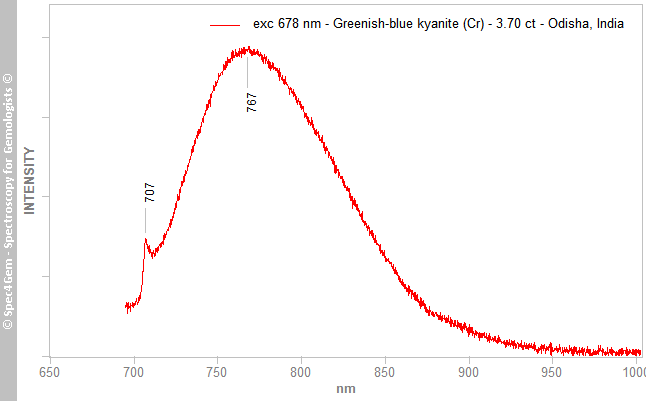 Figure 7. Photoluminescence spectrum of the 3.70 ct greenish-blue kyanite from Odisha, India excited by the 678 nm laser. The 760 / 767 nm large emission band attributed to Cr3+ in site B prevails on the Cr3+ emission center of site A with its Cr3+ R1 line at 707 nm which is just visible . The laser beam is oriented perpendicular to the stone length.
Conclusion:
The so particular greenish-blue color of this 3.70 ct kyanite reportedly from Odisha state in India is the result of Cr3+ and Fe3+ however Cr3+ is believed to be the major cause of color.
Updates:
- December 2013, T. Pradat, personal communication, SEM analysis revealed the black inclusions to be ilmenite, the other inclusions to be zircon crystals. Chromium is the color cause.
- Spring 2014, Gems News International section of GIA Gems & Gemology journal, pp. 87-88, T. Pradat & G. Choudhary (Gem Testing Laboratory, Jaipur, India): UV-Vis-NIR spectroscopy in the 300–800 nm region (figure 44) showed broad absorption bands between 500 and 700 nm, with a slight shift in the center position from about 585 nm (green direction) to 610 nm (blue direction). Also present were distinct peaks at approximately 370, 380, 417, 432, 446, 690, and 708 nm. The latter two peaks are associated with Cr3+ and the rest to Fe3+. The broad absorption band is attributed to the Fe2+-Ti4+ charge transfer (see G. Bosshart et al., “Blue colour-changing kyanite from East Africa,” Journal of Gemmology, Vol. 18, No. 3, pp. 205–212).
According to the present report, the color cause is mainly Cr3+ with the possible contribution of Fe3+, the 600 nm bands are primarily ascribed to Cr3+ that contradicts the attribution to Fe2+-Ti4+ as stated above. Is this a just a transcription error in the Gems & Gemology journal?
[1] Mineralogical Applications of Crystal Field Theory, R. G. Burns, 2005, ISBN: 0521017858 | 978-0521017855
[2] On the origin of colour and pleohroism of kyanite, G. H. Faye, E. H. Nickel, The Canadian Mineralogist, Vol 30, No 35, 1969
[3] Blue colour-changing kyanite from East Africa, G. Bosshart et al., Journal of Gemmology, Vol. 18, No. 3, pp. 205–212
[4] Physical properties and thermodynamic behaviour of minerals, K. Langer, DOI:10.1007/978-94-009-2891-6, p.661
[5] Kyanite Visible Spectra - List of Visible Data Files on the Caltech Mineral Spectroscopy Server
[6] Modern Luminescence Spectroscopy of Minerals and Materials, 2nd Edition, M. Gaft, R. Reisfeld, G. Panczer, Springer Editor, ISBN: 9783319247632