
Marialite scapolite with red epidote and titanite cabochon from Ica, Peru
- Details
- Created: Friday, 31 March 2023 10:28
The material described in this report has been widely available in online stores. It has been sold for a while as white marble with red cinnabar inclusions from Mexico. The piece showed in figure 1 is an oval cabochon measuring about 29 x 22 mm and weighting 30.20 ct. It is mainly white and red but it also exhibits some yellowish green inclusions (some cabochons contain much less of the later inclusions). The cinnabar is a lead mineral and it must be handled with care (washing hands after manipulating). Its hardness is low, 2.5 on Mohs scale, marble is just above at 3, a visual observation shows the red inclusions look harder than the white marble because the marble is recessed relative to the red inclusions. Without having a genuine marble with cinnabar for comparison, it is difficult to be certain of the real nature of this cabochon. Being a rock, it is almost impossible to use the classical gemological tools to establish the host and included minerals.
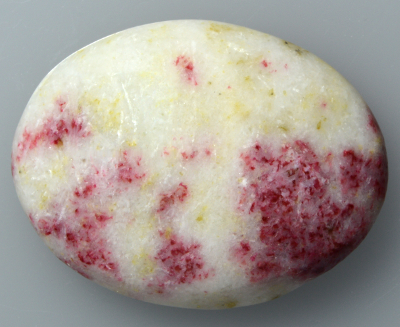 Figure 1. This 30.20 ct cabochon of marialite and manganon epidote
shows a third mineral colored in yellowish green that is better seen
with the camera than with the naked eye or lens..
| Shape | oval cabochon |
| Size | 29 x 22 x 7 mm |
| Color | white (marialite), red (epidote) and yellowih-green (titanite) |
| Diaphaneity | opaque |
| Lustre | dull |
| Weight | 30.20 |
| SG | 2.50 |
| RI | - |
| DR | - |
| Pleochroism | - |
| Polariscope / Conoscope | - |
| SWUV | marialite is pink red, epidote looks deep red but spectroscopy does not detect any luminescence |
| LWUV | inert |
| Magnetic susceptibility N52 | very weak attraction |
| Chelsea filter | inert, the stone almost looks like without the filter |
Table 1. Observational and measured properties
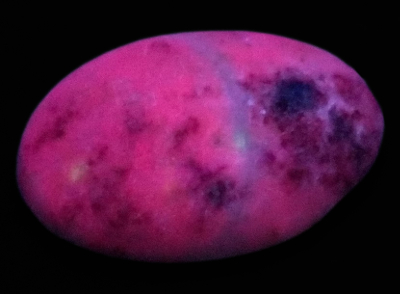 Figure 2. The cabochon exposed to the SWUV lamp shows a pink
red luminescence for the white material and deep red one for the red
inclusions.
The exposition to UV light radiations shows two distinct red tones while under short-wave UV lamp (see figure 2), but the cabochon is inert under the long-wave UV lamp. The white material shows a pink red luminescence and the red one a deep rep luminescence. The pink red luminescence of the supposed marble is consistent with marble except it is inert under SWUV. The red luminescence of the supposed cinnabar is consistent with the cinnabar luminescence, 660 nm while excited at 337 nm, Gorobets 2002[1].
Infrared reflectance spectroscopy:
The multiple IR reflectance spectra collected from different areas (white, red parts, top and back) of the cabochon can be classified in two categories. The white material gives a spectrum as shown in figure 3, it is incomparable with marble (calcite, dolomite) one, see database for reference. The spectrum matches the scapolite ones and its 624.5 cm-1 band identifies it as marialite, the sodium scapolite, which it forms a series with the meionite, the calcium scapolite.
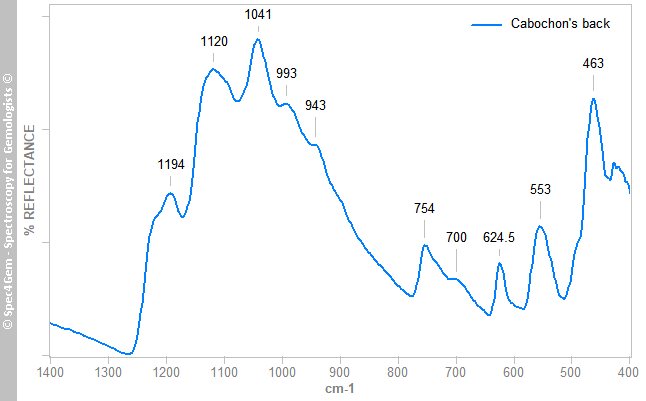 Figure 3. IR reflectance spectrum of the white areas collected on cabochon's back that globally identifies the white material as marialite a member of the scapolite group.
The red areas gives spectra as the spectrum shown in figure 4, it does not match the cinnabar ones but resembles the marialite one as shown in figure 3 with additional bands labelled in red. The 1024 cm-1 band is not a reflectance band but can be considered as an absorption band. These extra bands are usually observed in the minerals of the epidote group. The FTIR equipment configuration does not permit to point to a small spot as the red inclusions are, thus it is impossible to get a more specific spectrum.
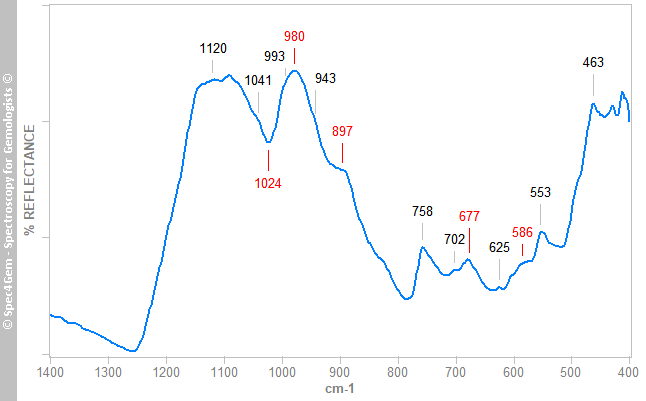 Figure 4. IR reflectance spectrum of the red areas collected on cabochon that globally identifies the minerals of the area as marialite scapolite and possibly minerals of the epidote group.
The IR reflectance spectroscopy identifies marialite as the main mineral of this cabochon and red epidote for the red inclusions.
Raman spectroscopy:
Using a 636 nm Raman system equipped with a 10x microscope objective, the collected Raman spectra at different spots (repeated and in distinct area of the cabochon) are shown in the figure 5, 6 and 7. None of them matches the marialite and Raman spectra as it could be expected from the IR spectroscopy.
The red mineral's spectrum is shown in figure 5 and it is compared to epidote and clinozoisite Raman spectra published on RRUFF. The position of the Raman peaks indicates epidote, the(CaCa)(AlAlFe3+)O[Si2O7][SiO4](OH) member rather than (CaCa)(AlAlAl)O[Si2O7][SiO4](OH) clinozoisite member, again a series exists between the epidote and clinozoisite. The red epidotes are often piemontite, another epidote group member (CaCa)(AlAlMn3+)O[Si2O7][SiO4](OH) where Mn3+ replaces Al, but some red colored epidotes are also found through the iron ones (CaCa)(AlAlFe3+) namely epidote, likely colored by manganese and refered as 'manganoan epidote'.
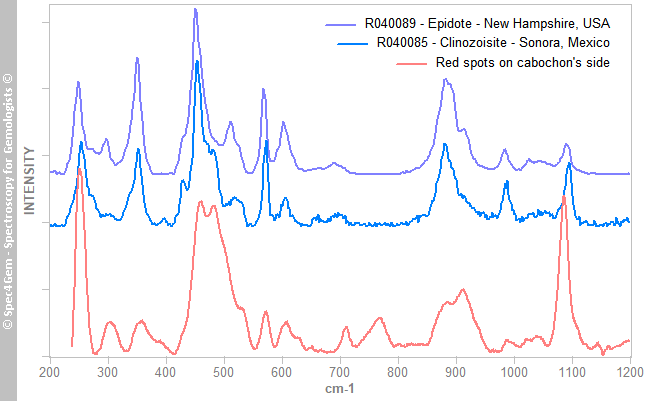 Figure 5. The Raman spectrum of the red mineral, compared to epidote group members spectra, matches the epidote one that corresponds to the iron epidote. Reference spectra are offset and normalized for clarity.
The yellowish-green mineral's spectrum is shown in figure 6 indicates the mineral is titanite, a titanium oxide also known as sphene. The titanite is a strong ramanizer, it is easy to get Raman spectra of it. The R050114 Titanite from RRUFF is given for reference and comparison.
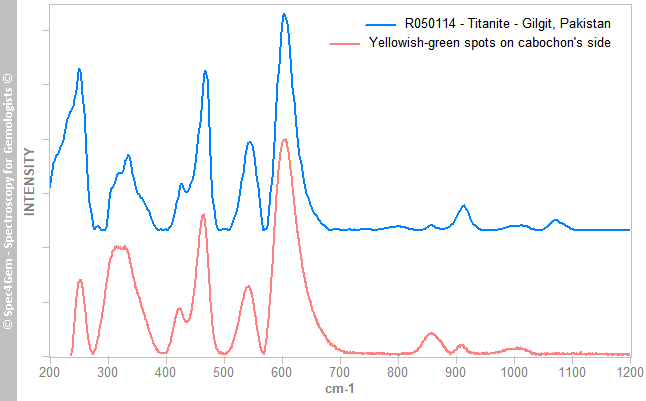 Figure 6. The Raman spectrum of the yellowish green mineral, matches the titanite Raman spectra, as the one from a titanite from Gilgit. Reference titanite spectrum is offset and normalized for clarity.
The third mineral's spectrum is shown in figure 7, collected from white to colorless spots from the cabochon's top indicates the mineral is a plagioclase, a calcium-sodium feldspars. It better matches with bytownite and labradorite ones but theses intermediates members from the albite-anorthite series are now referred as anorthite variety bytownite (respectively labradorite).
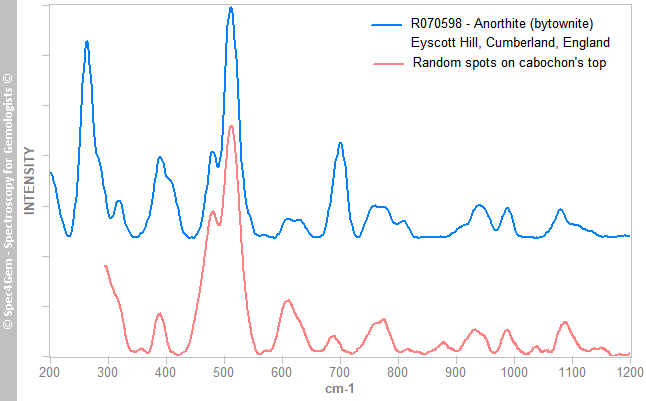 Figure 7. The Raman spectrum of the white to colorless crystals from the cabochon's top, matches the labradorite/bytownite varieties of anorthite, a plagioclase feldspars. The Raman spectrum of a bytownite from RRUFF database is given for reference and comparison. Bytownite spectrum is offset and normalized for clarity.
The Raman spectroscopy reveals the yellowish green mineral's inclusions is titanite, some white to colorless crystals are plagioclase and it confirms the red mineral is an epidote and more precisely an iron epidote (not a clinozoisite nor a piemontite, nor cinnabar).
UV-VIS-NIR spectroscopy:
The cabochon is almost opaque and just translucent in thinner parts with a strong light making the spectra collection rather difficult, no longer willing to slab / slice gems for analysis. The spectra of the white end red parts are shown in figure 8, the white part produces an increasing absorption continuum from 800 nm towards UV, the red part gives two broad absorption bands at 440 and 535 nm, thus in the blue, green and yellow areas of the visible spectrum, explaining the red color. Both spectra show the same absorption feature at 970 nm, it is related to the presence of OH hydroxyl groups in the crystalline structure, this is consistent with epidote and scapolite.
The Vis spectra were collected (as well as the PL ones) before the IR and Raman ones, thus without having an idea of the real nature of the cabochon. Although the vis spectroscopy is not diagnostic in lots of cases it can be of a great help to guide the researches. In the case of this cabochon, the camel humps shape ot the spectra is similar to the already observed piemontite's spectra. Under no circumstances, it is similar to cinnabar's spectrum which shows a very steep absorption edge just above 600 nm.
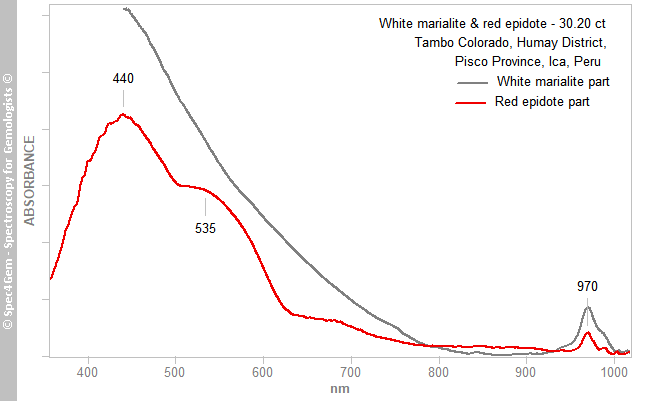 Figure 8. The Vis-NIR spectra of the white and red areas show a common feature at 970 nm related to the OH roup. The red part spectrum is shaped a two absorption humps like in piemontite caused by Mn3+.
The two main broad absorption bands at 440 and 535 nm are similar to what can be observed in piemontite (the Mn3+ epidote) and in a less extent in pink zoisite, another member of the epidote group. The spectrum is unpolarized, therefore it combines the spectra of the two or three polarized spectra as it could be expected in a monoclinic mineral. Piemontite's spectra are shown in figure 9 for comparing with the red inclusions spectrum, the camel humps bands are so similar, the red epidote color of this cabochon is very likely due to Mn3+ as it is for piemontite.
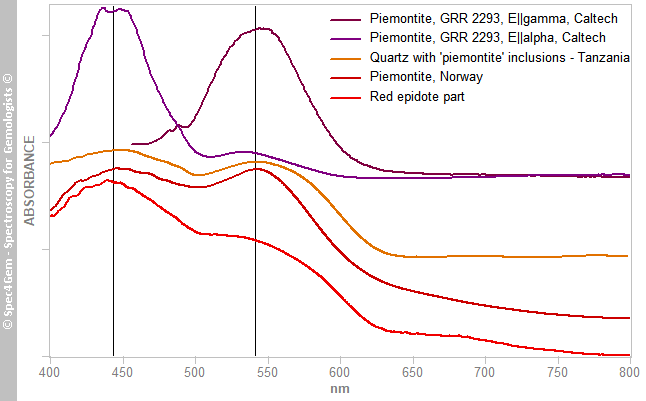 Figure 9. The Vis-NIR spectra of the red part of the cabochon is shown in comparison to piemontites' spectra from different locations, the strong similarities suggest these epidote inclusions owe their red color to Mn3+.
Photoluminescence spectroscopy:
As for the Vis spectroscopy, the PL spectroscopy was performed before the IR and Raman ones without knowing the real nature of the minerals of the cabochon. The PL spectra, collected with the 405 nm laser and 254 nm excitations, are shown in figure 10. With 405 nm excitation, the white part exhibits a emission peak at 625 nm consistent with the Mn2+ in the calcite (marble), although the red part has not any luminescence detected. With the 254 nm excitation, an emission at about 705 nm is observed and the red part does not produce any emission. That being said, the emissions at 625 and 705 nm are pretty common in the scapolite group, the first one is given for Mn2+ emission and the last one for Fe3+.
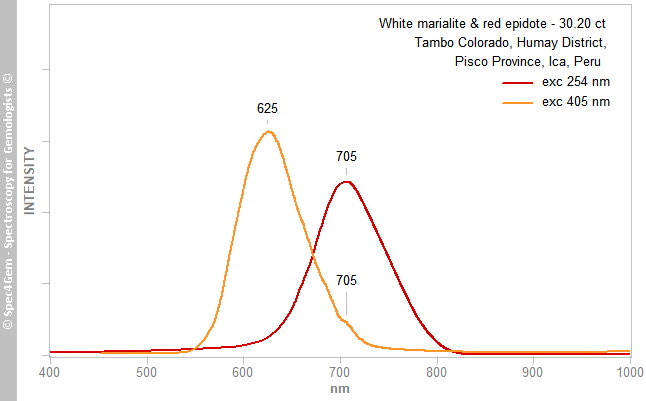 Figure 10. Photoluminescence spectra of the marialite part at the 254 and 405 nm excitations, epidote does not luminesce at these excitations. The 625 and 705 nm emissions are respectively related to Mn2+ and Fe3+.
Conclusion:
This cabochon is mainly composed of white marialite, some red manganoan epidote and in a less extent of some white to colorless plagioclase and yellowish green titanite.
At the time of writing, mindat listed a new location 'Rosalinda' occurrence, Tambo Colorado, Humay District, Pisco Province, Ica, Peru with a picture of a similar cabochon that makes possible to put a location on this gemstone material.