
Ethiopian opals showing grayish-lilac opalescence and girasol effect
- Details
- Created: Friday, 28 July 2017 07:58
1994 discovery was made in the Menz Gishe District in the northern part of the Shewa Province. Despite their beauty, these opals are quite unstable and have crazing problems. They are known in the market as Shewa and Mezezo opals according to their locality of origin. Since then, the 2008 discovery near the town of Wegel Tena in the Wollo Province in the northern part of the country has changed things radically, the wello (wollo) opal is not subject to crazing. In 2013, another discovery was made again in the Wollo Province, but about 100 kilometres north of the Wegel Tena area. Most of the opals in this deposit have a translucent gray to black bodycolor.
The two opals of this report are from Ethiopia, most likely wello opals but the exact locality is unknown. The aim of this report is not to describe again ethiopian opal (even if in fact there is few literature about spectroscopy studies), but is to 'simply' describe what many of us have seen without really knowing the phenomenon.
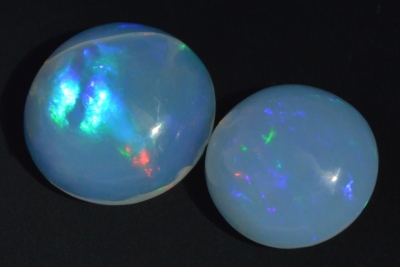 Figure 1. The 6.20 and 4.26 ct Ethiopian opals showing their color
play on hazy grayish-lilac background. Outdoor picture in partly
cloudy sky with the sun being visible.
| Shape | round cabs |
| Size | Ø 14.4 x 4.2 mm and Ø 12.6 x 5.7 mm |
| Color | grayish-lilac with color play |
| Lustre | dull vitreous |
| Weight | 6.20 and 4.26 ct (after few seconds in water: 6.33 and 4.39 ct, unchanged after 3 weeks kept in a plastic bag where they could not dry out) |
| SG | ~1.7 |
| RI | between 1.39 and 1.40 |
| DR | not applicable |
| Pleochroism | not applicable |
| Polariscope / Conoscope | light through 360° rotation |
| SWUV | 6.20 ct stone: weak bluish-white, 4.26 ct stone: inert |
| LWUV | 6.20 ct stone: weak bluish-white, 4.26 ct stone: inert |
| Magnetic susceptibility N52 | both: diamagnetic |
| Chelsea filter | both: light-pink |
Table 1. Observational and measured properties
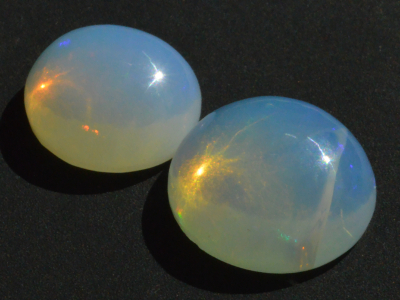 Figure 2. Outdoor picture, the sunlight hits the stones on their right
part (white spots reflections) and exits them on the opposite side
after a reflection on the stone's back (yellow spots). The stone is
grayish-lilac on sun side and yellowish on the opposite one.
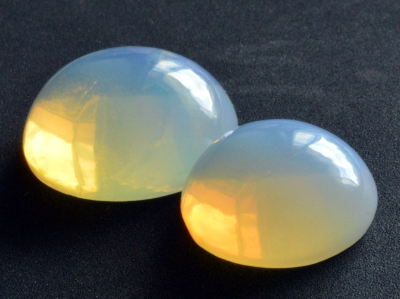 Figure 3. Indoor picture, the sky light through the window hits the
stones from the top right direction, the stones look grayish-lilac on
that side. The transmitted light that exits the stones on the opposite
side is yellow for the biggest opal and orangish-yellow for the
smallest one.
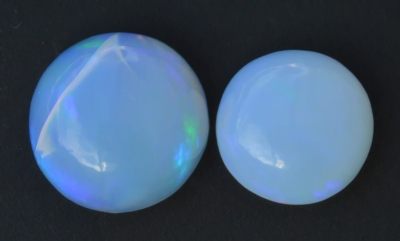 Figure 4. Outdoor picture but from a view from the top, in reflected
skylight the stones show an hazy grayish-lilac color.
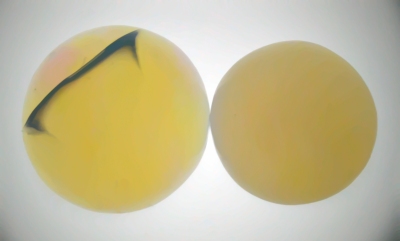 Figure 5. In transmitted light (artificial white light, same result with
direct sunlight), the stones look yellow and orangish-yellow.
Infrared reflectance spectroscopy:
The infrared reflectance spectra were acquired from both cabs but only that of the 6.20 ct stone is published in figure 6. As expected, a characteristic opal spectrum with its three groups of bands is observed: 478, 783 and 1101, 1253 cm-1.
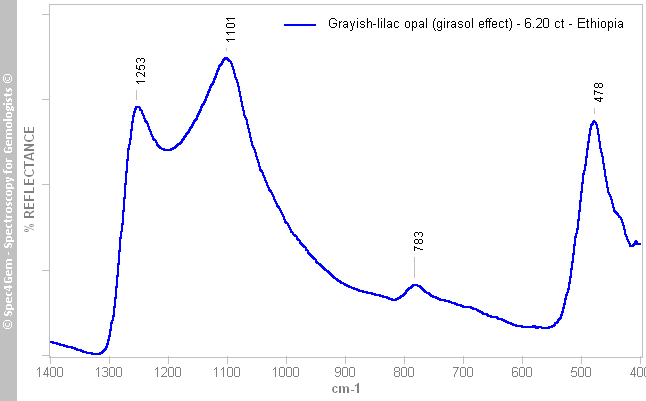 Figure 6. IR reflectance spectrum of the 6.20 ct opal cab. It shows a characteristic opal spectrum with its three groups of bands at 478, 783 and 1101, 1253 cm-1.
 UV-VIS-NIR spectroscopy:
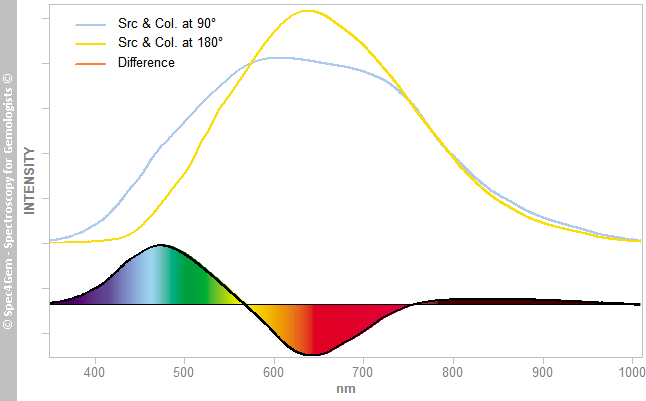
UV-VIS spectra of the 6.20 ct opal cab (figure 7) were acquired in absorption mode with two different setups. The yellow spectrum corresponds to the setup where both collector and source are facing each other with the cab in the middle (aligned, 180° setup). The grayish spectrum corresponds to the setup where the collector collects the light at a right angle to the source - cab direction (90° setup). Plays of color or other optical phenomenons may affect the spectroscopic results. Acquiring multiple spectra with changing the light path position within the stone can be used to overcome such problems.
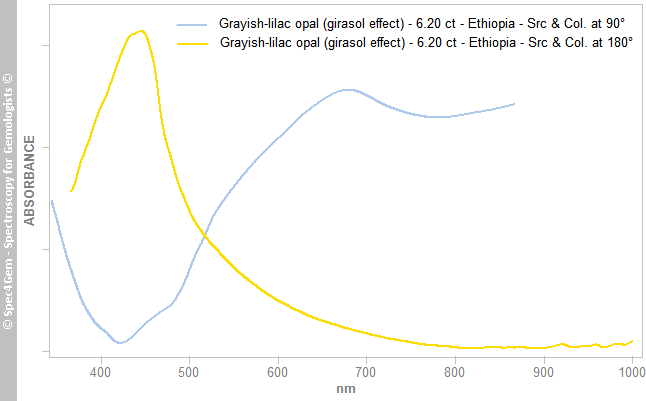 Figure 7. UV-VIS spectra of the 6.20 ct opal cab acquired in absorption mode with two different setups (180° setup: yellow spectrum, collector-cab-source are aligned; 90° setup: grayish-lilac spectrum, collector_|_cab-source). The light path being different in the two setups, it does make sense to compare absorption as values but it shows the 'transmitted' light is different according to the direction in which it is observed. In the 180° setup, blue and green are not transmitted and yellow and red are, thus the transmitted light is mostly yellow-orange whereas in the 90° setup, the blue and green are transmitted and yellow and red are not, thus creating the grayish-lilac color.
The light path being different in the two setups, it does make sense to compare absorption as values but it shows the 'transmitted' light is different according to the direction in which it is observed. In the 180° setup, blue and green are not transmitted and yellow and red are, the transmitted light is then mostly yellow-orange whereas in the 90° setup, the blue and green are transmitted and yellow and red are not, thus creating the grayish-lilac color. It looks like if there is an absorption of the violet, blue and green colors while the light it transmitted in a straight direction in the stone. Conversely, these three colors are transmitted in other directions forming an angle lower than 90° with the source. This is not the result of pleochroism which is not applicable to the opal material (amorphous, crypto-crystalline to micro-crystalline).
Even if the absorption mode already explains the difference in colors while the stone is seen in transmitted or partly reflected light, the same kind of experiment can be done measuring the light intensity in both setups (90° and 180°). The corresponding spectra are available in figure 8, the pink spectrum is the emission spectrum of the halogen light source used in the experiment. The yellow spectrum (180° setup) is very similar to that of the halogen source with the the following exception: violet and blue are not transmitted. The grayish-lilac spectrum (90° setup) shows the violet, blue and green are transmitted whereas the yellow, orange and red are transmitted with some attenuation.
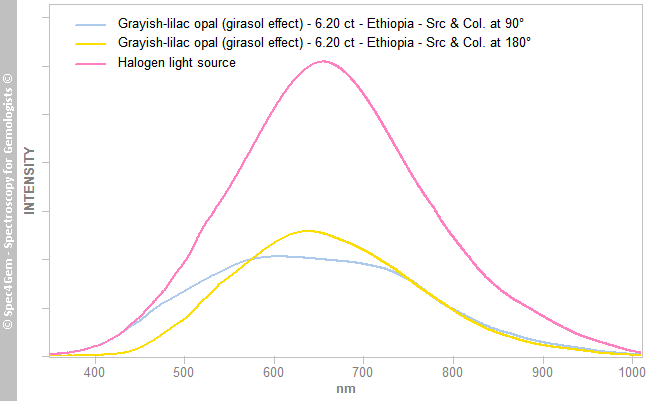 Figure 8. Light measurements obtained with the two setups (90° and 180°) compared to that of the halogen source. They clearly show the differences in the collected light between the blue and yellow.
Drawing the difference between the spectra of both setups illustrates the balance between the observed colors. The 180° setup was arbitrary chosen as the reference, so the spectra difference was calculated as diff = spectrum_90° - spectrum_180°. The result is presented in figure 9 where visible light colors were added to help to understand what is going on. From the 90° setup, the collector (spectroscope or eye) gets more blue than yellow-orange in comparison to the 180° setup. As noted earlier, this is not the result of any pleochroism, but this more like what is observed with the sun and the sky! The sun light is comparable to halogen one (should be better to put it the other way around), at sunset looking towards the sun the sky color is mostly yellow/orange/red, whereas looking at the sky in other directions it is blue! This phenomenon is explained by light scattering in the atmosphere particles. Few types of scattering exist: Mie, Rayleigh.
Opal plays of color is explained by interference between scattered light on the tiny silica particles composing opal. Here, only the scattered light is concerned. As seen on the pictures, these opals also show plays of color but the most interesting phenomenon is the light scattering that modifies the stone color according the direction it is observed in relation to the light source.
The observed phenomenon is described as the girasol effect - 'blue tint in reflection and orange tint in transmission'. Note that 'girasol' in spanish means sunflower!
Photoluminescence spectroscopy:
As only the biggest stone (6.20 ct) shows a weak bluish-white reaction under both SW and LW sources, the photoluminescence spectrum (figure 10) was acquired from that stone before its immersion in water for measuring SG.
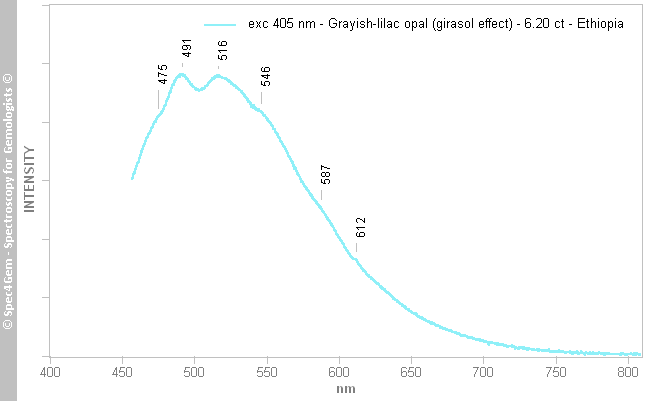 Figure 10. Photoluminescence spectrum of the 6.20 ct opal acquired with a 405 nm source. The emission covers most of the visible spectral range from almost 400 nm to 700 nm with the maximum emission around 515 nm. Some remarkable features are present at 475, 491, 516, 546, 587 and 612 nm. The global emission of such emission pattern results in an almost bluish-white light.
 The observed luminescence is likely the result of the 'ST' (Singlet-Triplet) organic molecules which are responsible for the extrinsic bluish-white luminescence in minerals usually of sedimentary origin. Tanzanian opals being of volcanic origin, such organic molecules traces are not consistent with these opals origin except if the organic molecules were absorbed after the forming because of their hydrophane property.
Conclusion:
These grayish-lilac opals (bluish tint) owe their main color to light scattering and show the girasol effect. The gemological data are consistent with opal, the Infrared Reflectance spectroscopy confirmed the opal material. The bluish-white luminescence is likely caused by organic molecules.